Cryptocurrency analysts of Coinidol.com report, the price of Avalanche (AVAX) is falling below the moving average lines.
Long-term analysis of the Avalanche price: bearish
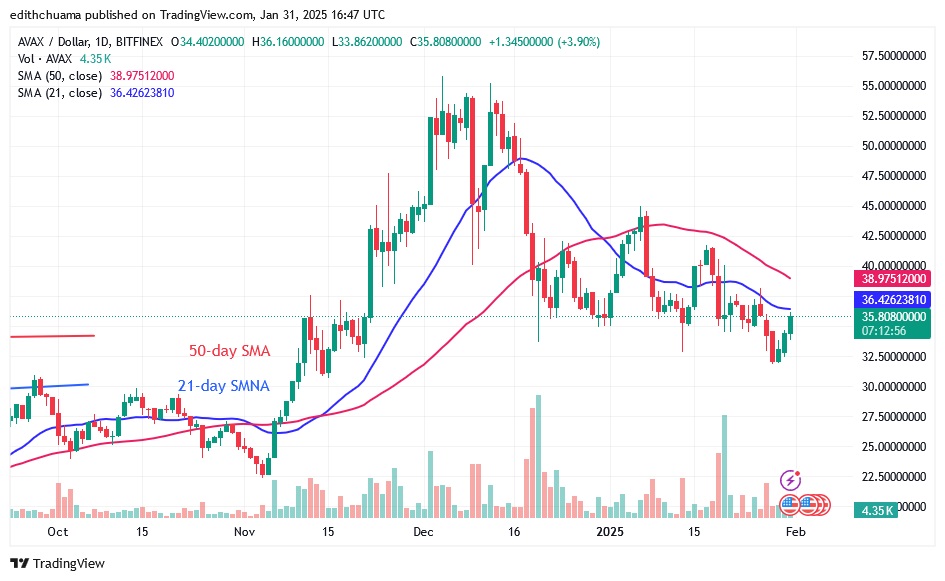
On January 28, the downtrend stopped above the $32 support level. The bulls bought the dips and the price corrected upwards. The uptrend has stalled at the 21-day SMA. If the upside momentum breaks above the moving average lines, AVAX will test its previous high of $45. On the other hand, if the altcoin turns down from the 21-day SMA and falls below the $32 support, it will drop much further to $20. In the meantime, AVAX is in a limited range.
Analysis of the Avalanche indicator
Analysis of the Avalanche indicator
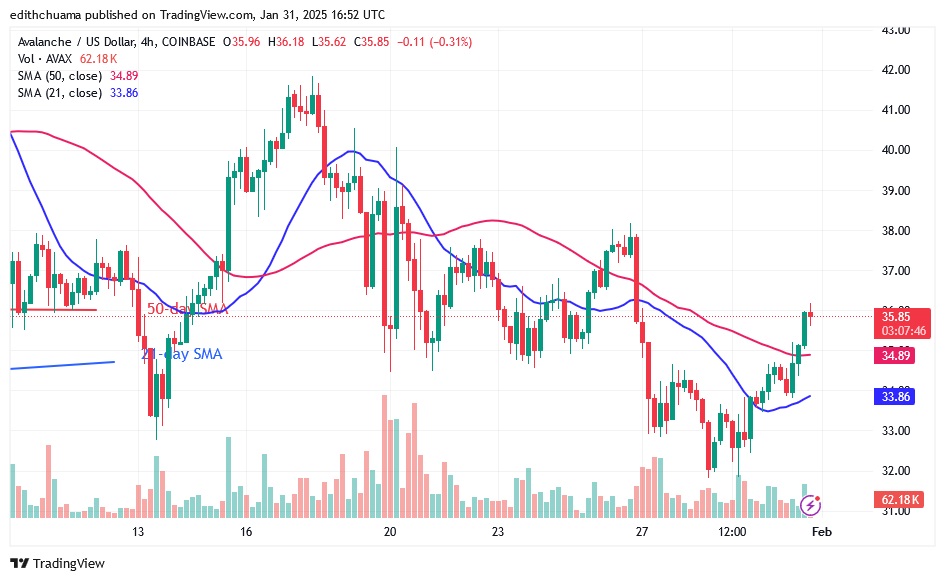
The price bars continue to move below the 21-day moving average line. The 4-hour chart shows that the price bars have risen above the moving average lines. However, the bullish momentum has stalled at the $36 high. Despite the upward correction, the moving average lines are moving downwards.

Technical indicators:
Key resistance levels – $60 and $70
Key support levels – $30 and $20
What is the next direction for Avalanche?
What is the next direction for Avalanche?
AVAX’s price is below the moving average lines and could fall further. On the daily chart, selling pressure will return after the altcoin was pushed back through the 21-day SMA. If the current support is broken, AVAX will drop to the next support level of $20.

Disclaimer. This analysis and forecast are the personal opinions of the author. They are not a recommendation to buy or sell cryptocurrency and should not be viewed as an endorsement by CoinIdol.com. Readers should do their research before investing in funds.
CoinIdol.com News – Read More


