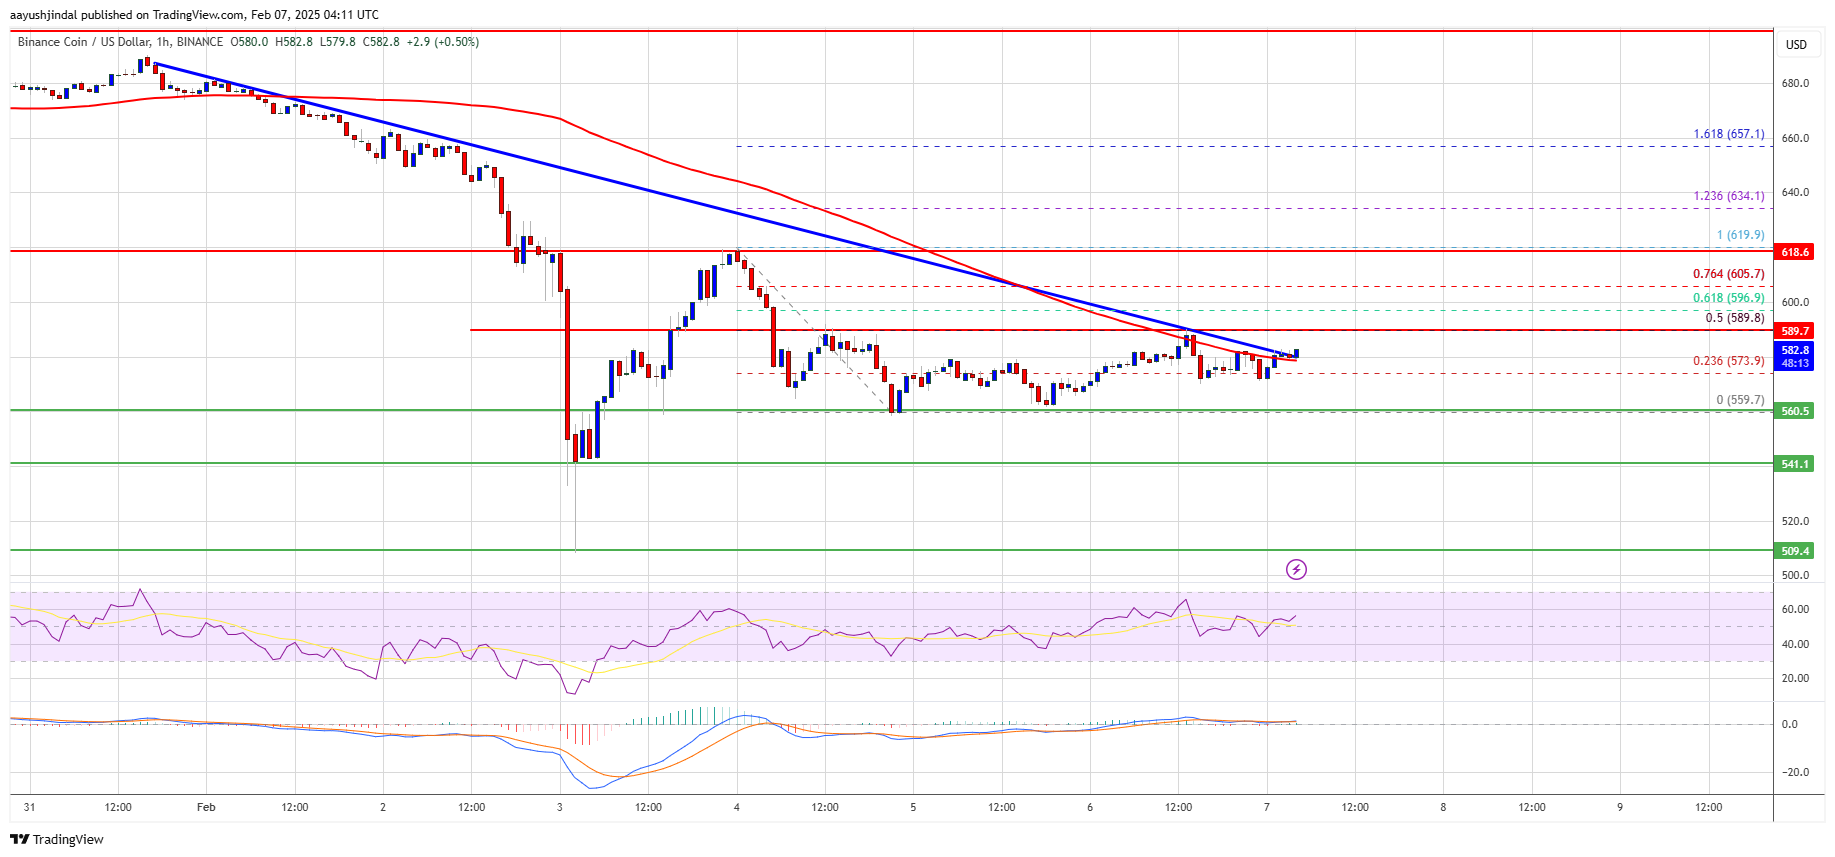
According to Trading View, BNB has experienced significant volatility recently, leaving investors to wonder if it can regain momentum. After a surge near $619, the token has struggled to consistently hold above $620, mirroring the rapid fluctuations seen in Ethereum and Bitcoin.
A Bumpy Road to Recovery
Following its impressive run to $619, BNB couldn’t sustain the climb, and the price soon started to retrace. The pullback was swift—sending prices dipping below the $600 mark and, at one point, even tumbling under $580. The decline reached a nadir at $559, a level that has now become a turning point.
After forming this bottom, the token rebounded, climbing past the $570 threshold. This is a key moment because it shows buyers are stepping in to back the token after its recent drop. Now that the price is rising above the 23.6% Fibonacci level (measured from the high of $619 to the low of $559), raising hopes for its climb again.
Resistance Levels to Watch
One of the key moments in its recent action came when it managed to break above a critical bearish trend line around the $578 mark on the hourly chart. Now trading near $580—coinciding with its 100-hourly simple moving average—the token is at a crossroads.
Even with the recent ups and downs, the technical signals still look promising. The hourly MACD for the BNB/USD pair is moving into positive territory, hinting that buyers may be regaining control. Also, the RSI is comfortably above 50, which suggests there’s enough strength to keep pushing the price upward.
Support is holding strong around $560 and $540—if this break, the price might drop even further. On the other side, resistance is building at $590 and $605, which it needs to overcome for a solid rally. These levels give us a clear roadmap for the next moves. In this fast-changing market, every breakout or breakdown offers important hints about BNB’s direction.

If it gains more strength, it could soon run into resistance near $590. Breaking above this level—which also marks the 50% Fibonacci retracement—could open the door to testing the next hurdle around $595. However, if BNB fails to push past $this resistance, it could signal a return to bearish sentiment. In that scenario, initial support appears to be clustering around the $570 mark, with more substantial support levels at $560 and the critical $540 threshold. A break below $540 might even send prices spiraling down toward $532 or as low as $510.
Can BNB Break Through the $730 Barrier Amid a Bullish Surge?
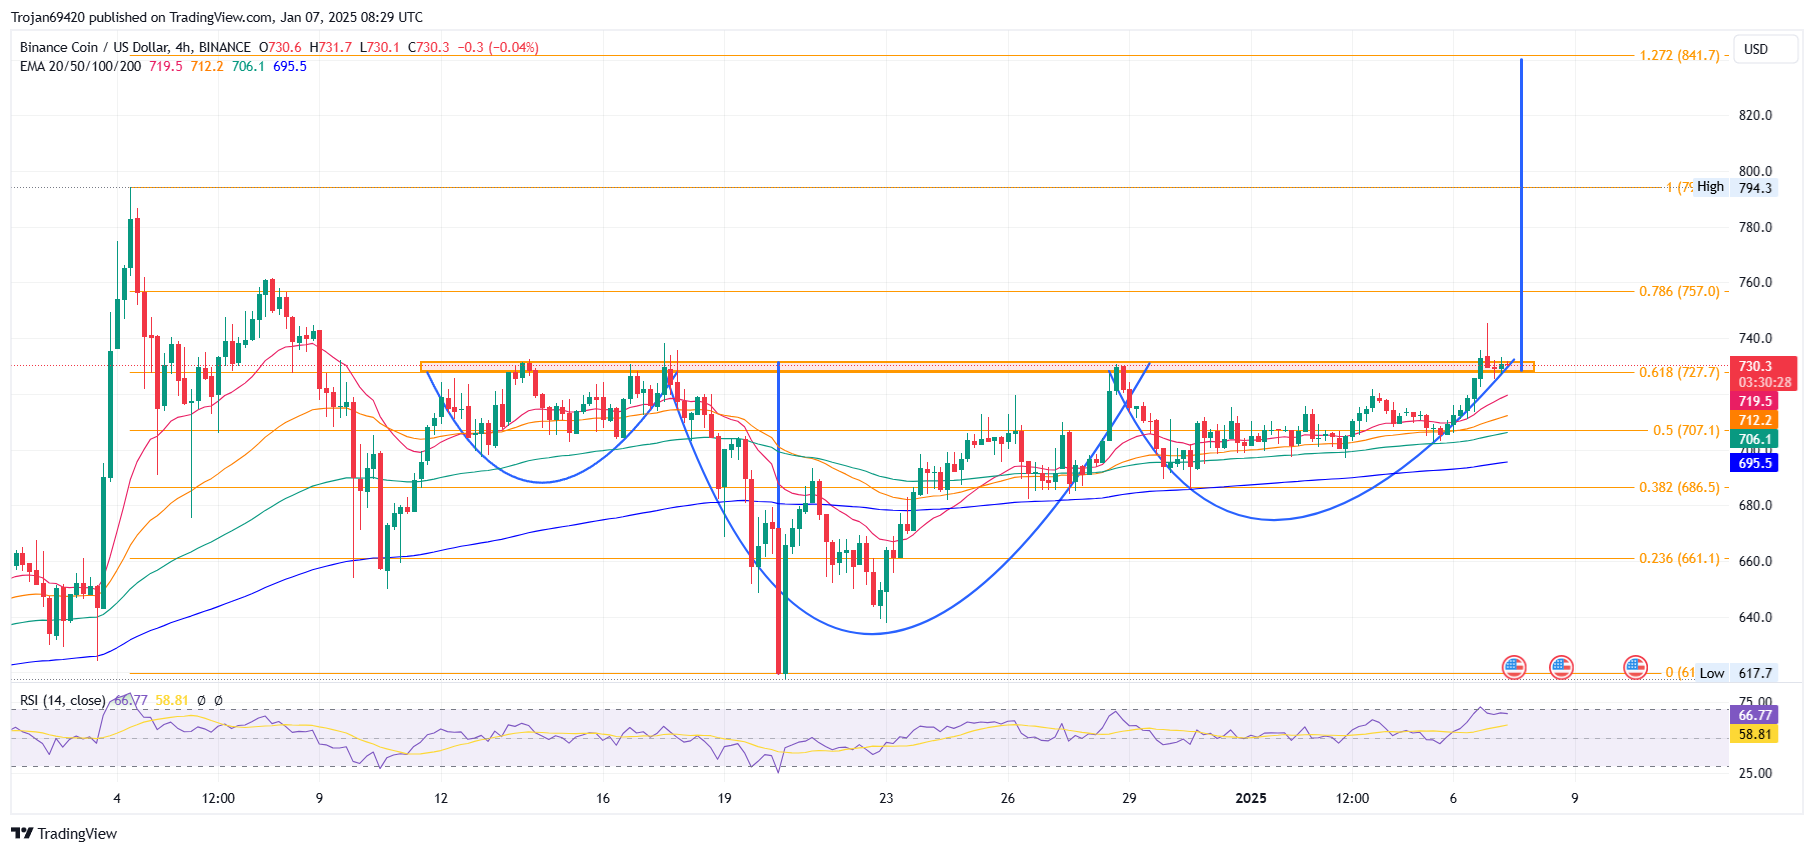
BNB’s 4-hour chart reveals a robust resistance slightly above $730, with the supply zone stretching between $728 and $731, aligning with the Fibonacci retracement. A 2.90% surge last night underscores a bullish recovery that may signal an inverted head and shoulders pattern.

Critical EMA lines have turned bullish, while the RSI nears the overbought threshold, providing a compelling buy signal. The emerging morning star pattern suggests a potential retest at the current Fibonacci level. If a strong breakout occurs, resistance may shift to $757 and $795 and possibly extend toward $840. Key support is observed at the 100 EMA near $705.
Will BNB’s NFT Boom, DEX Surge, and $BERA Airdrop Propel It to $1,000?
The NFT sales on the BNB network have surged 24% in the last week, hitting $1.5 billion, with nearly 24,000 buyers recorded. The Binance Smart Chain also saw decentralized exchange transactions jump to $2.4 billion in 24 hours, according to DefiLlama. A growing token burn rate is further reducing supply. As technical analysis shows bullish signs, if this altcoin breaks the $793 resistance level, it could continue climbing, potentially reaching the $1,000 mark soon.
Meanwhile, the Berachain $BERA airdrop has been announced, sparking renewed market activity and optimism. Rising trading volumes, strong technical signals, and active blockchain data suggest that BNB stakers may soon enjoy real benefits. Moreover, the positive impact is reaching the AI and blockchain sectors, hinting at broader market gains.
Conclusion:
BNB is at a turning point. After a strong run to nearly $619, it pulled back but is now showing signs of recovery, with support around $560 to $540. If it can break through resistance at $590 and $605, it might push higher—possibly toward $1,000. However, if it fails to overcome these levels, further declines could follow. Meanwhile, rising NFT sales, increased DEX trading, and the $BERA airdrop add positive momentum to the token. Investors should keep an eye on these key levels as this altcoin charts its next move.
Stay tuned to The BIT Journal and watch Crypto’s updates. Follow us on Twitter and LinkedIn, and join our Telegram channel to be instantly informed about breaking news!
Frequently Asked Questions (FAQs)
1. Why is BNB experiencing volatility?
It has faced rapid fluctuations due to market trends, mirroring Ethereum and Bitcoin’s price action.
2. What caused its recent pullback?
After hitting $619, BNB failed to hold above $620, leading to a swift decline below $600 and even $580.
3. What is the significance of the $559 level?
$559 marked a turning point where buyers stepped in, sparking a rebound above $570.
4. What resistance levels should investors watch?
BNB faces resistance at $590 and $605, with stronger barriers at $730 and $795.
5. What happens if it breaks above $590?
A successful breakout could pave the way for testing $595, $605, and higher resistance levels.
6. What are the key support levels for BNB?
Strong support lies at $560 and $540, with critical levels at $532 and $510 if selling pressure increases.
Glossary of Key Terms:
Binance Smart Chain (BSC) – A blockchain enabling fast, low-cost transactions and smart contracts.
BNB (Binance Coin) – Binance’s native cryptocurrency used for fees, trading, and payments.
Resistance Levels – Price points where selling pressure prevents further upward movement.
Hourly MACD – A momentum indicator that tracks trend direction using two moving averages on an hourly chart.
RSI (Relative Strength Index) – A momentum oscillator measuring price strength on a scale of 0 to 100.
Fibonacci Retracement – A tool identifying support and resistance levels based on key Fibonacci ratios.
Key Support – A price level where buying pressure helps prevent further declines.
EMA (Exponential Moving Average) – A moving average that gives more weight to recent prices for better trend analysis.
Simple Moving Average (SMA) – A basic moving average that smooths price data over a set period.
References:
Trading View: https://www.tradingview.com
Crypto News: https://crypto.news
Defillama: https://defillama.com
Blockchain News: https://blockchain.news
The Bit Journal – Read More


