


With Bitcoin crossing $98,000, can bulls push past resistance to hit a new all-time high?
As the crypto market gradually turns green, Bitcoin is back above $98,000. With a 24-hour surge of 1.14%, the biggest crypto is gradually inching closer towards the $100,000 mark.
While the short-term recovery projects a potential breakout rally, institutional investment continues to decline. Amid the rising outflows from Bitcoin spot ETFs, could this be a dead cat bounce for Bitcoin? Let’s explore.
Bitcoin Breakout Rally Hits 50% Fibonacci Barrier
In the 4-hour price chart, BTC’s price trend shows a channel breakout rally. This bullish breakout follows a reversal from the local support trendline.

Currently, the rally faces resistance at the 50% Fibonacci level at $98,611. Along with key supply zones near this level, a long-standing descending trendline adds additional bearish pressure.
Due to this opposition, BTC’s price action shows a short-term pullback, with the price down to $98,269. Despite the strong resistance, the overall short-term recovery has shifted the Chaikin Money Flow Index from negative to positive.
With rising inflows, the bullish recovery has increased the breakout chances. Furthermore, the Bollinger Bands are projecting a potential bullish reversal after remaining sideways over the last week.
Rising Leverage Drives The BTC Rally
One of the key drivers behind Bitcoin’s recent pump appears to be the leverage market. A recent tweet by Maartunn, a crypto quant analyst, highlights a surge in Bitcoin open interest. “Leverage-driven pump,” he tweeted.
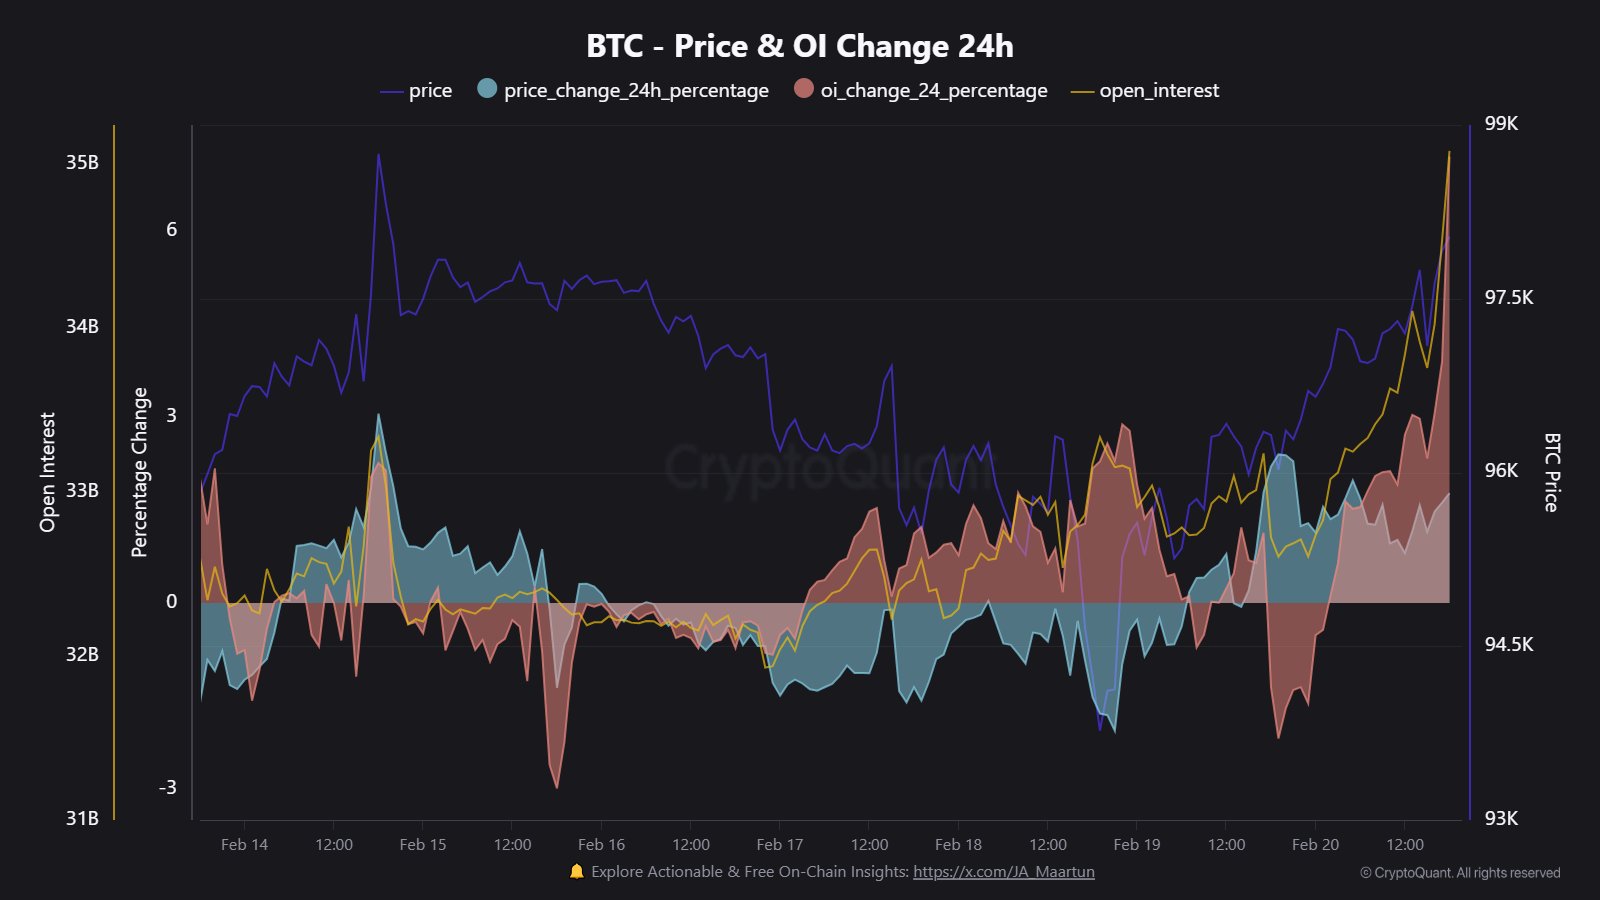
The open interest (OI) has risen by $2.4 billion over the past 24 hours, reflecting a 7.2% increase. This surge has pushed open interest back to nearly $35 billion.
The rise in open interest reflects the anticipation among Bitcoin traders for a high-volatility move. However, the trend’s direction cannot be determined solely based on open interest.
Declining Demand in Bitcoin ETFs
Adding to the uncertainty, U.S. Bitcoin spot ETFs saw a net outflow of $364.93 million on February 20. Only two Bitcoin ETFs recorded net inflows.
These were Bitwise with $24.14 million and VanEck with $4.18 million. Surprisingly, the key sellers included BlackRock, which shifted from consistent buying to minor offloading.
BlackRock’s Bitcoin ETF saw $112.05 million in outflows, followed by ARK and 21Shares, which dumped $98.35 million. Fidelity offloaded $88.24 million. Grayscale’s Bitcoin Trust and Mini Bitcoin Trust disposed of nearly $94.62 million.
Despite the short-term decline in Bitcoin ETF demand, the overall trend remains positive. According to a recent tweet by Ki Young Ju, the founder of Cryptoquant, the bull cycle should persist unless significant ETF outflows occur.

A prolonged period of net negative demand would be a key trigger, potentially signaling the start of a new bear cycle. As the CEO put it:
“Demand and supply are all that matter. Everything else is just noise.”
Bitcoin Price Targets
With the Cryptoquant CEO staying optimistic about the overall ETF market, the possibility of a breakout rally in Bitcoin’s price remains significant.
According to the Fibonacci levels, a breakout from the immediate resistance at $98,611 will likely propel Bitcoin to the $100,000 mark.
Beyond this, the next crucial resistance lies at the $108,000 supply zone, just above the horizontal level of $107,123. Optimistically, Bitcoin’s next all-time high could be at $112,058, based on the 1.272 Fibonacci level.
On the flip side, key support levels are the 38.2% Fibonacci level at $96,703. Additionally, a potential dip to the broken resistance trendline near the $97,000 mark could offer a post-retest bounce.
Latest Cryptocurrency News – The Crypto Basic – Read More