


Ripple’s native token has been trading within an expanding wedge pattern, recently finding support at the lower boundary.
Until a decisive breakout occurs, further consolidation is expected within its current range, defined by the 100-day moving average and the $2 support level.
XRP Analysis
By Shayan
The Daily Chart
XRP has remained within an expanding wedge pattern over recent months, with the $2 support level acting as a strong defense line for buyers. This crucial price region aligns with the 0.5 Fibonacci retracement level, reinforcing its significance. Meanwhile, Ripple faces significant resistance at the 100-day moving average of $2.5, which is likely filled with supply.
As a result, the price remains confined within a tight range near the wedge’s lower boundary, suggesting continued consolidation in the short term. However, from a broader perspective, if XRP maintains support at this key level, an eventual breakout to the upside could trigger a fresh rally.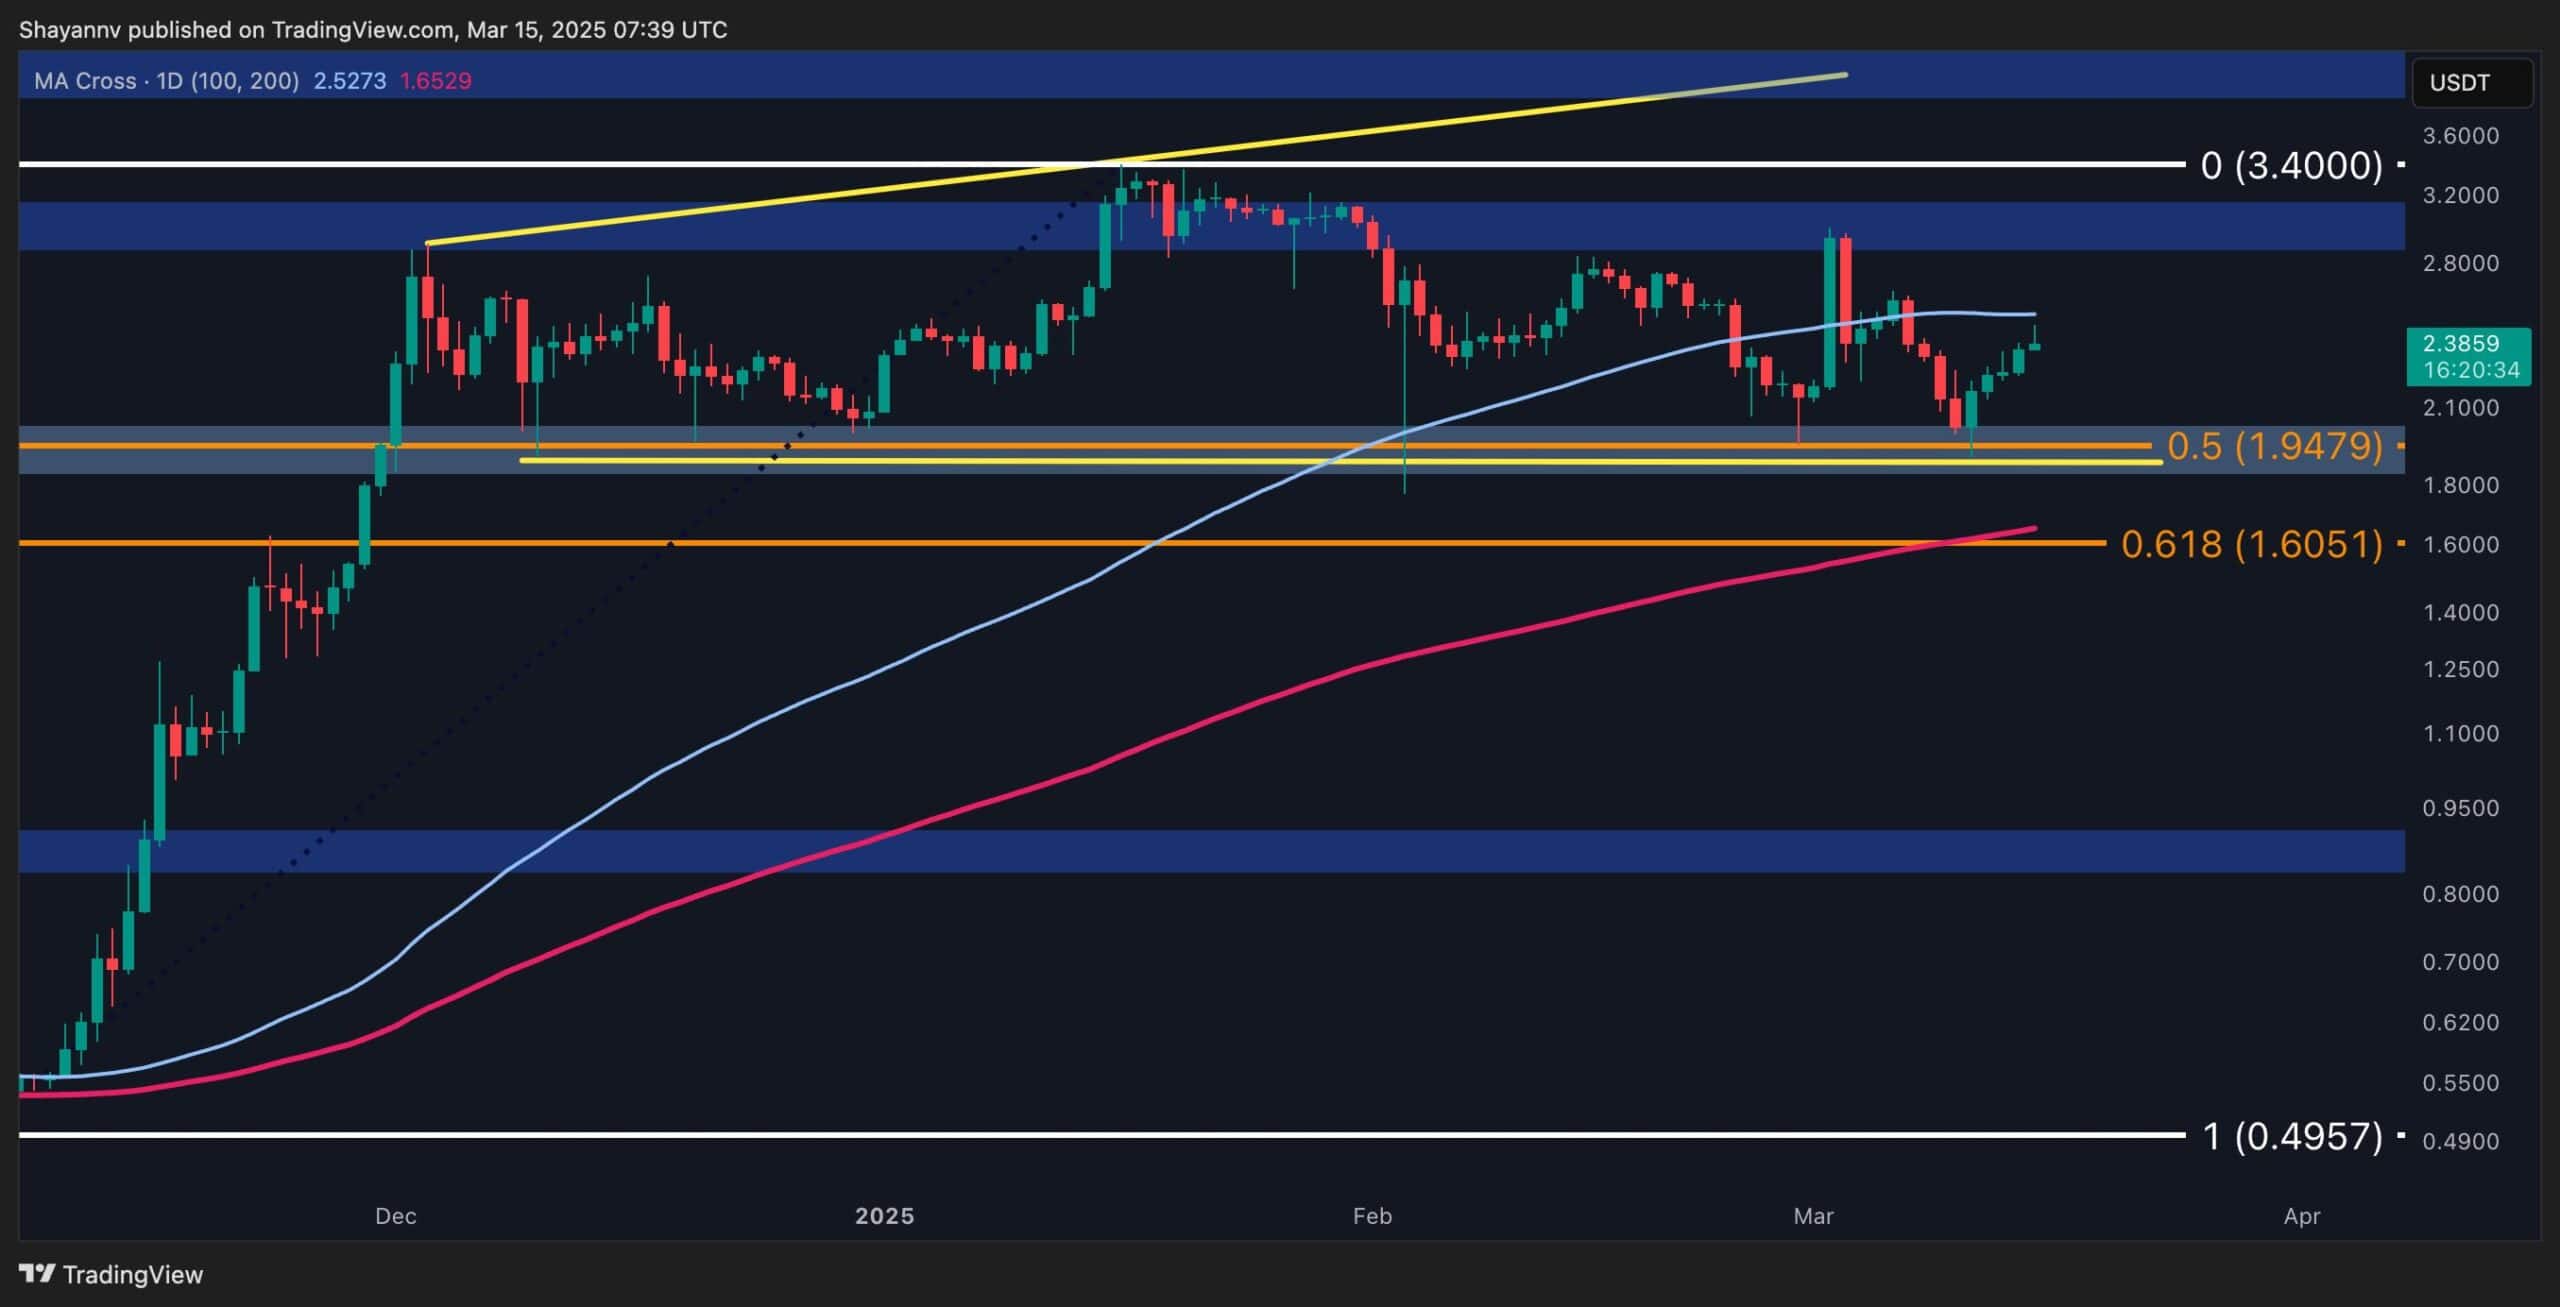
The 4-Hour Chart
On the lower timeframe, XRP has struggled to surpass the critical $2.8 resistance, leading to repeated rejections. Recently, the price dipped into a sell-side liquidity zone below a prior market low, which triggered a sharp bullish rebound. Additionally, Ripple has formed a bullish flag pattern and has found support at its lower boundary.
This price action suggests ongoing liquidity hunts and market cooling, potentially allowing smart money to accumulate. If a rebound materializes at this crucial level, a retest of the $2.8 resistance will likely follow.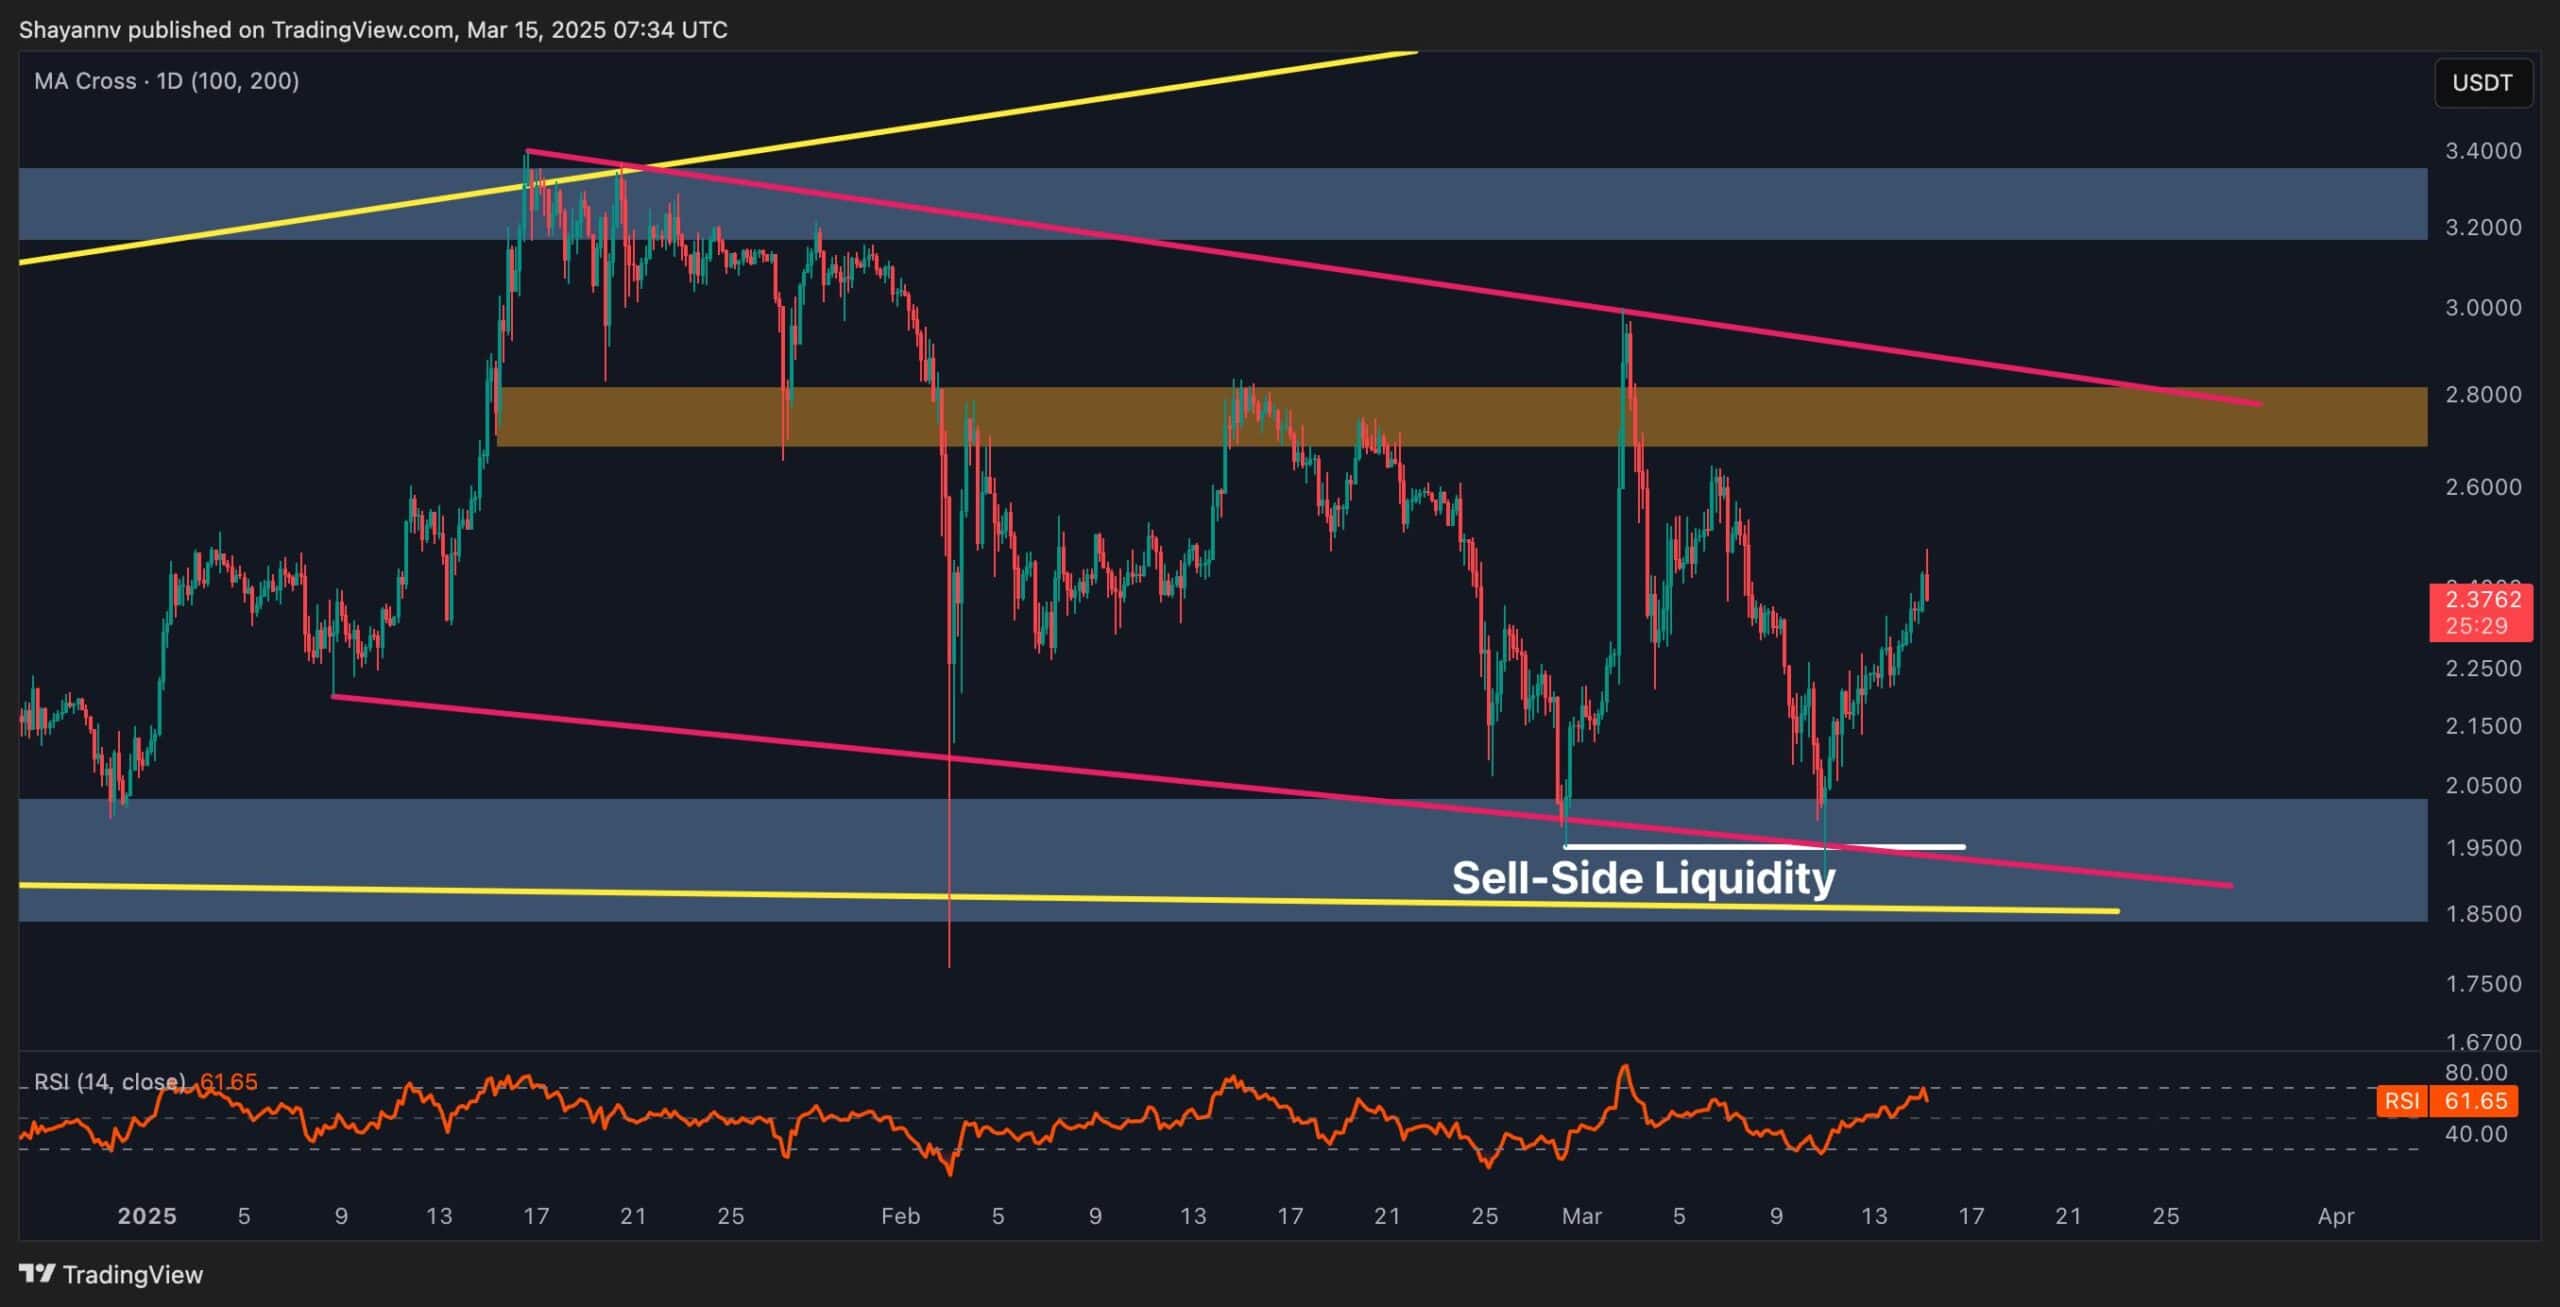
The post Calm Before the Storm for XRP? (Ripple Price Analysis) appeared first on CryptoPotato.
CryptoPotato – Read More