


Bitcoin stabilizes above $96K, signaling a potential breakout. Can BTC rally back to the $103K supply zone?
As Bitcoin stabilizes above the $96,000 mark, an intraday reversal hints at a strong bullish comeback. Furthermore, speculations in the crypto market suggest a strong bullish rally as fear gradually fizzles out.
Will this breakout rally propel Bitcoin to its $103k? Let’s find out.
Bitcoin Price Action and Key Support Levels
In the 4-hour chart, the BTC price trend finally ends the streak of lower-low formations as it takes support at the 38.2% Fibonacci level at $96,700. With this lower price rejection, a short V-shaped reversal is forming.

Currently, Bitcoin trades at $98,242 and challenges a short-term resistance trendline. Along with the trendline, Bitcoin also faces opposition from the 50% Fibonacci level at $98,611.
Chaikin Money Flow and Volume Analysis
As Bitcoin aims to restart the higher-low trend formation, the Chaikin Money Flow Index reflects a minor uptick in flow as it sustains a positive trajectory at 0.12. The bulls are maintaining a solid stand.
Furthermore, the up-and-down volume reveals a significant recovery on the bullish front, with 2X up volume supporting the reversal in Bitcoin prices. Hence, price action analysis reveals a high possibility of a breakout rally.
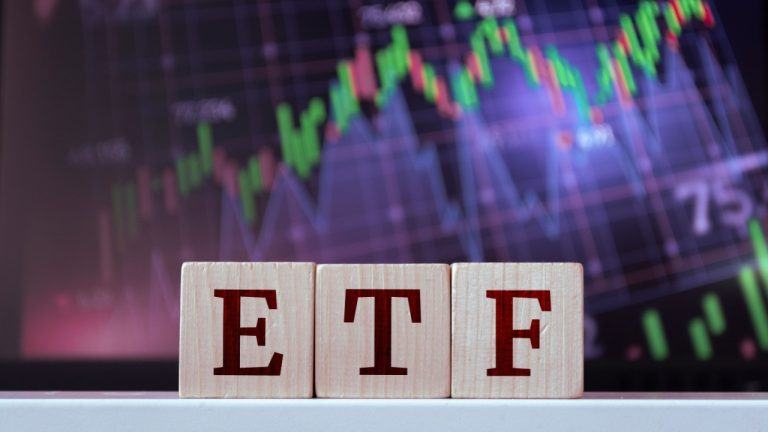
BTC ETF Flow
Amid growing optimism for a bullish recovery in the Bitcoin market, institutional support remains strong, reinforcing the upward momentum.
BlackRock led the daily net inflows with $44.35 million, followed by WisdomTree adding $11.38 million, and Fidelity acquiring $10.65 million worth of Bitcoin.

Bitcoin Derivatives Market Outlook
Bitcoin derivatives market remains significantly bullish, despite Bitcoin open interest dropping below $60 billion. Currently, the open interest has surged 1.43% in the last 24 hours, reaching $59.65 billion.

However, over the past 24 hours, the long-to-short ratio has significantly improved. From 0.9841 to 1.0454, the number of bullish players in the market has equalized the playing field.
Funding Rate Decline – A Bearish Signal?
While the long-to-short ratio suggests an almost equal number of bulls and bears, a drop in the funding rate indicates a stronger bearish stance.
The funding rate has dropped from 0.007% to 0.0024% over the past few hours. This signals a potential shift in momentum despite the overall bullish sentiment.
BTC Price Targets
The market anticipates a potential breakout rally as Bitcoin stabilizes above $96K and shows signs of a bullish reversal. Based on Fibonacci levels, the uptrend will likely challenge the 78.6% Fibonacci level at $103,393.
However, the declining funding rate suggests lingering bearish pressure, making the $94.3K support a crucial level to watch.
Latest Cryptocurrency News – The Crypto Basic – Read More