
The price of Binance Coin (BNB) has fallen again after breaking through its lower price area.
BNB price long term forecast: bearish
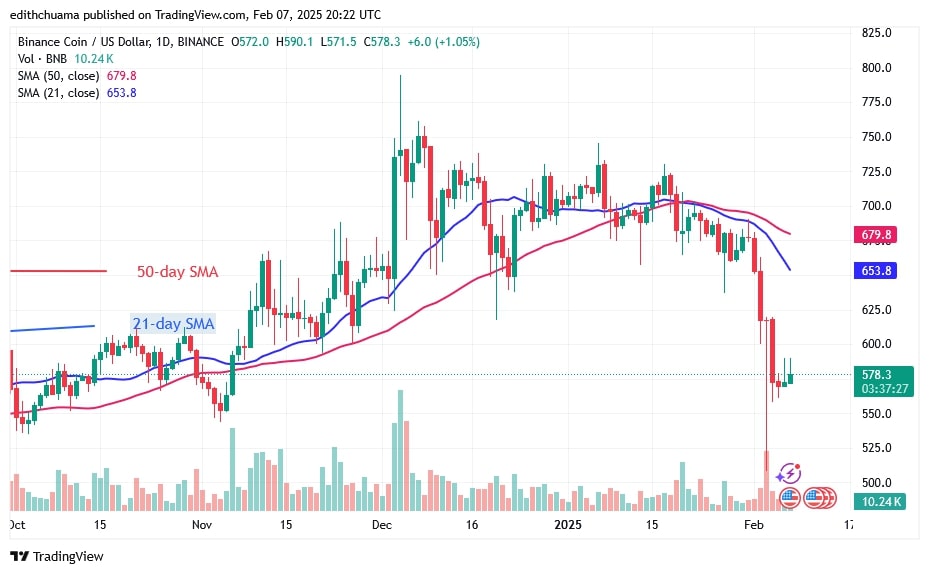
Since December 20, 2024, the altcoin has been hovering between $635 and $745. The bears broke the $635 support and dropped to the $508 support. However, the bulls bought the dips and the altcoin rallied above the $540 support.
BNB is currently trading below the moving average lines and above the support at $540. If the $540 support holds, BNB will rise and overcome the resistance at $635.
However, if the altcoin falls below the current support, it will also fall back to its previous low of $508. The current value of BNB is $587.
BNB indicator reading
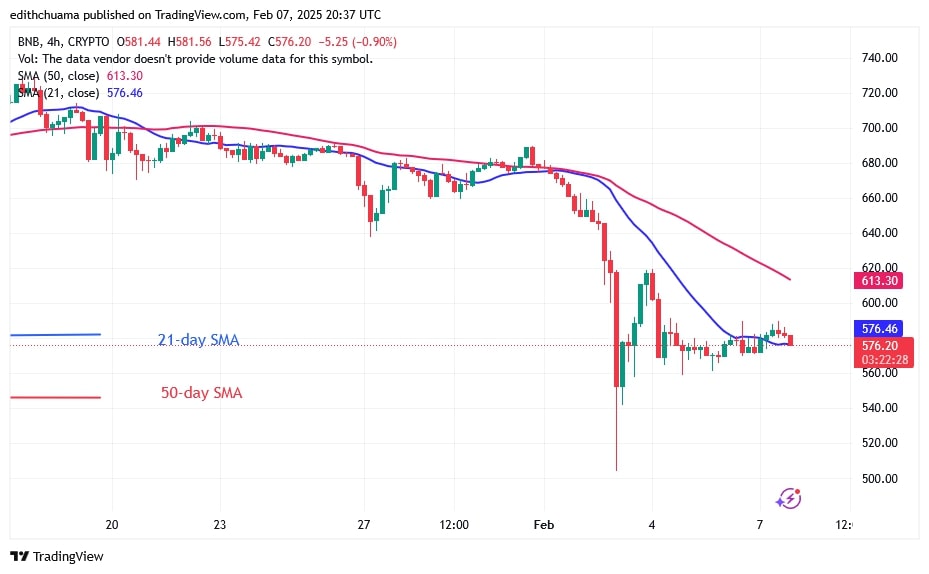
The moving average lines have a bearish crossover and are sloping downwards. While BNB is moving down, the moving average lines on the 4-hour chart are sloping horizontally. The Doji candlesticks are used to describe the price activity. The appearance of the doji candlesticks has forced the altcoin to go sideways.
Technical indicators:
Key Resistance Levels – $600, $650, $700
Key Support Levels – $400, $350, $300
What is the next direction for BNB/USD?
If the price breaks through the moving average lines, it will start to move higher. Due to the dominance of the doji candlesticks, the price action has been static so far. BNB is currently in a sideways movement after the recovery above the $540 support.
The bearish trend has ended, but the cryptocurrency price consolidated above the $560 support, as reported by Coinidol.com.
Disclaimer. This analysis and forecast are the personal opinions of the author. They are not a recommendation to buy or sell cryptocurrency and should not be viewed as an endorsement by Coinidol.com. Readers should do their research before investing in funds.
CoinIdol.com News – Read More


