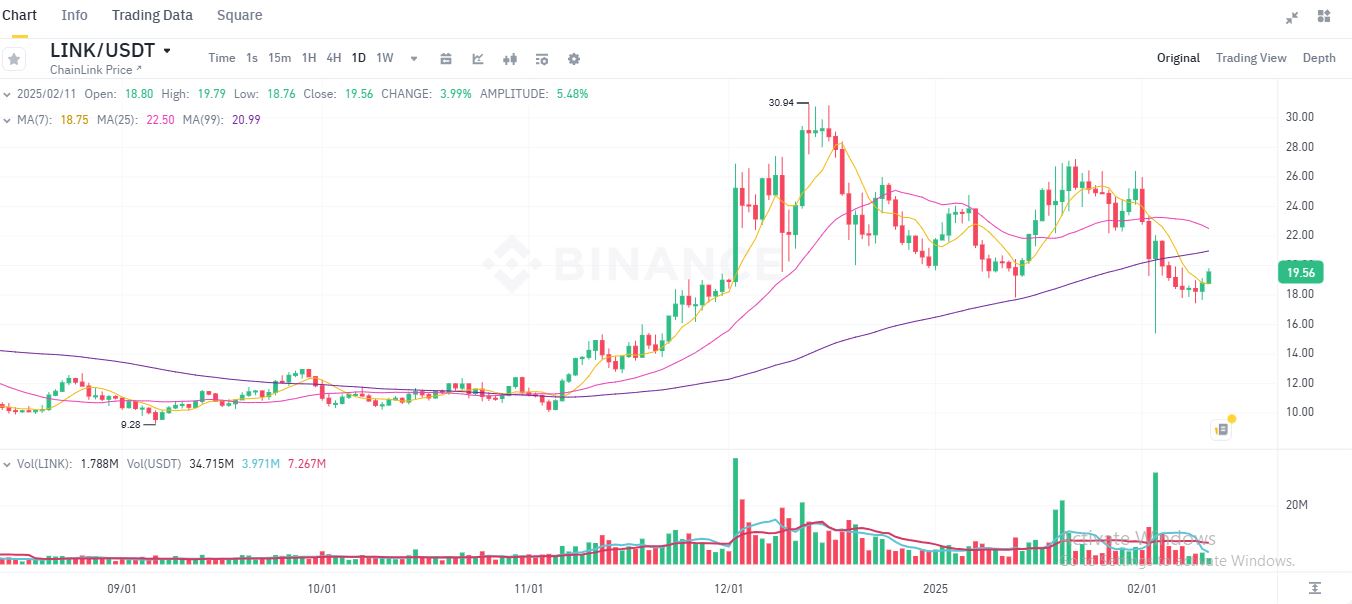
Chainlink [LINK] is approaching a key moment as it trades near the Bull Market Support Band at $18, according to AMB crypto.
Testing the Bull Market Support Band
In past market cycles, “Historically, holding above this level has signaled strong bullish momentum, allowing price continuation toward higher levels.”
For traders and long-term holders alike, maintaining support at the BMSB could be the launchpad for price targets above $25 in the weeks ahead.
This isn’t the first time Chainlink has faced such a pivotal moment. However, given the current market landscape—marked by regulatory uncertainties and fluctuating sentiment—every move counts. If LINK successfully holds above the BMSB, it may attract additional buyers looking for proof of a continuing uptrend.
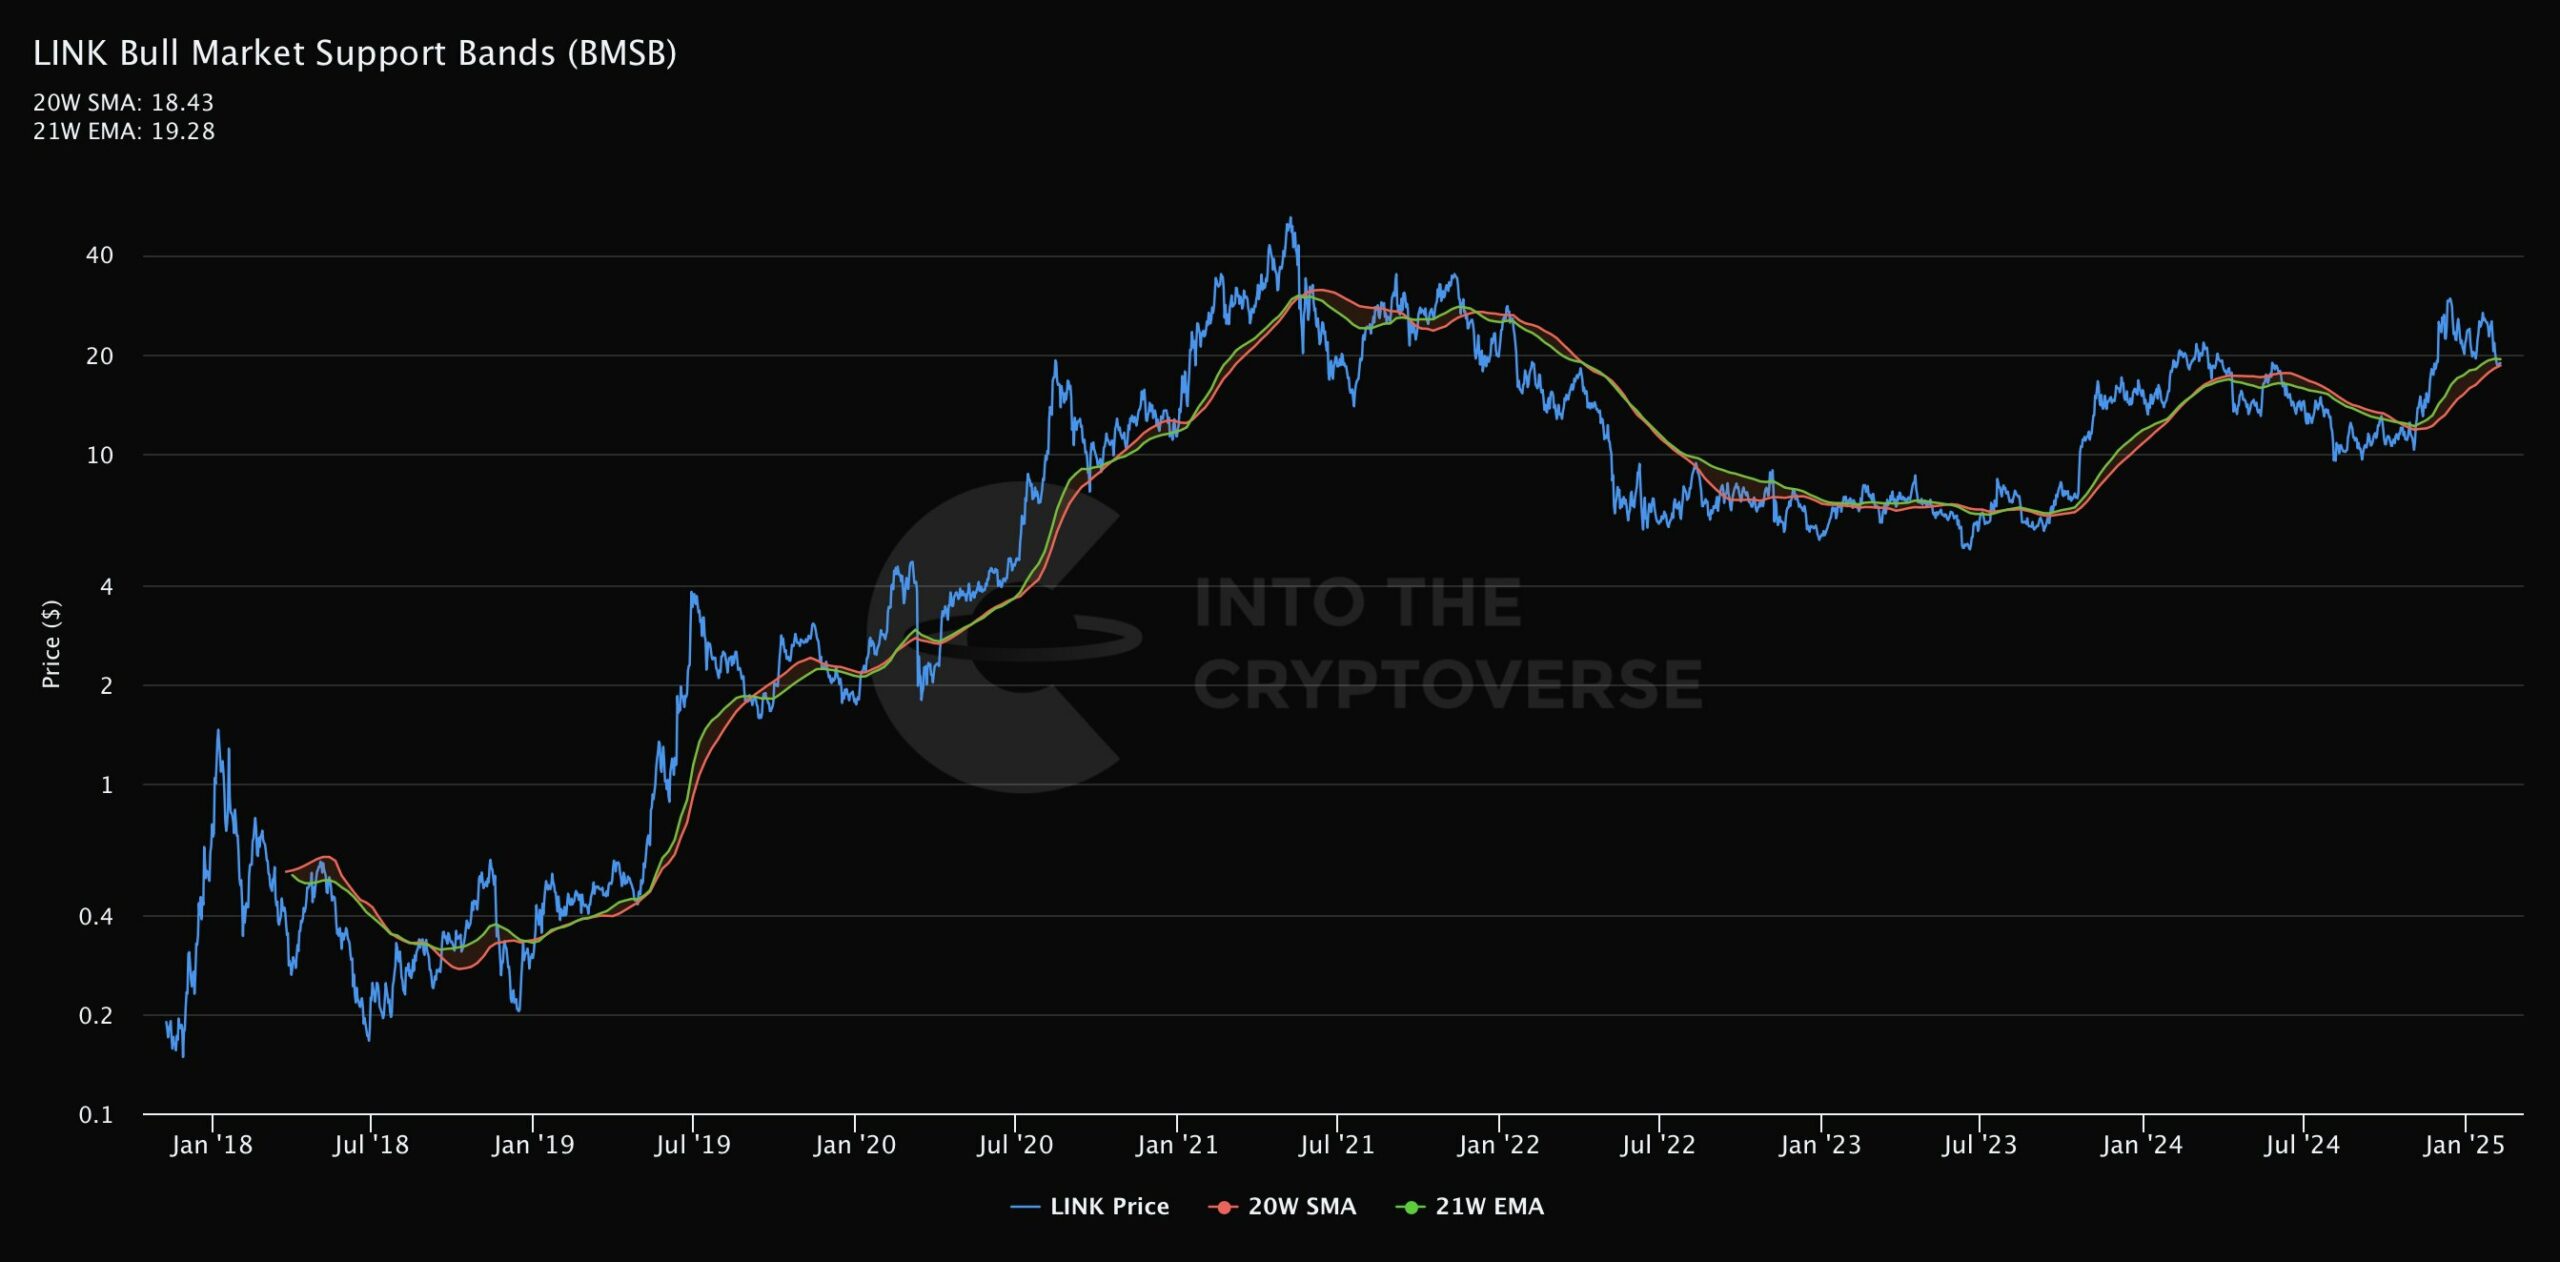
On the flip side, a confirmed breakdown below $18 could trigger significant selling pressure, potentially driving the token toward lower support levels near $16.80 or $14—both of which have served as accumulation zones in the past. A retest of these supports might encourage sidelined investors to buy at a discount, but it would also confirm a short-term bearish structure for Chainlink.
Analyzing LuxAlgo’s Structure Break
From a technical standpoint, the LuxAlgo structure break indicates a shift in momentum. As Chainlink hovers above $18, the bullish bias appears intact, but any sudden selling pressure could change that narrative. Notably, LINK’s daily chart showed a “long tail” bounce from the $18 region, suggesting buyers quickly stepped in to defend this key level.
Yet, volume remains relatively low, implying that a more robust wave of buying pressure is needed to sustain a breakout. Until this volume picks up, volatility may persist—and so might the risk of a price reversal.
MACD Hints at Rising Momentum
Adding to the bullish argument, the Moving Average Convergence Divergence (MACD) recently flashed an encouraging signal. The MACD line crossed above the signal line near $18, confirming mild upward momentum. If this trend holds, it could test resistance levels at $22 and even $25 in the near term.
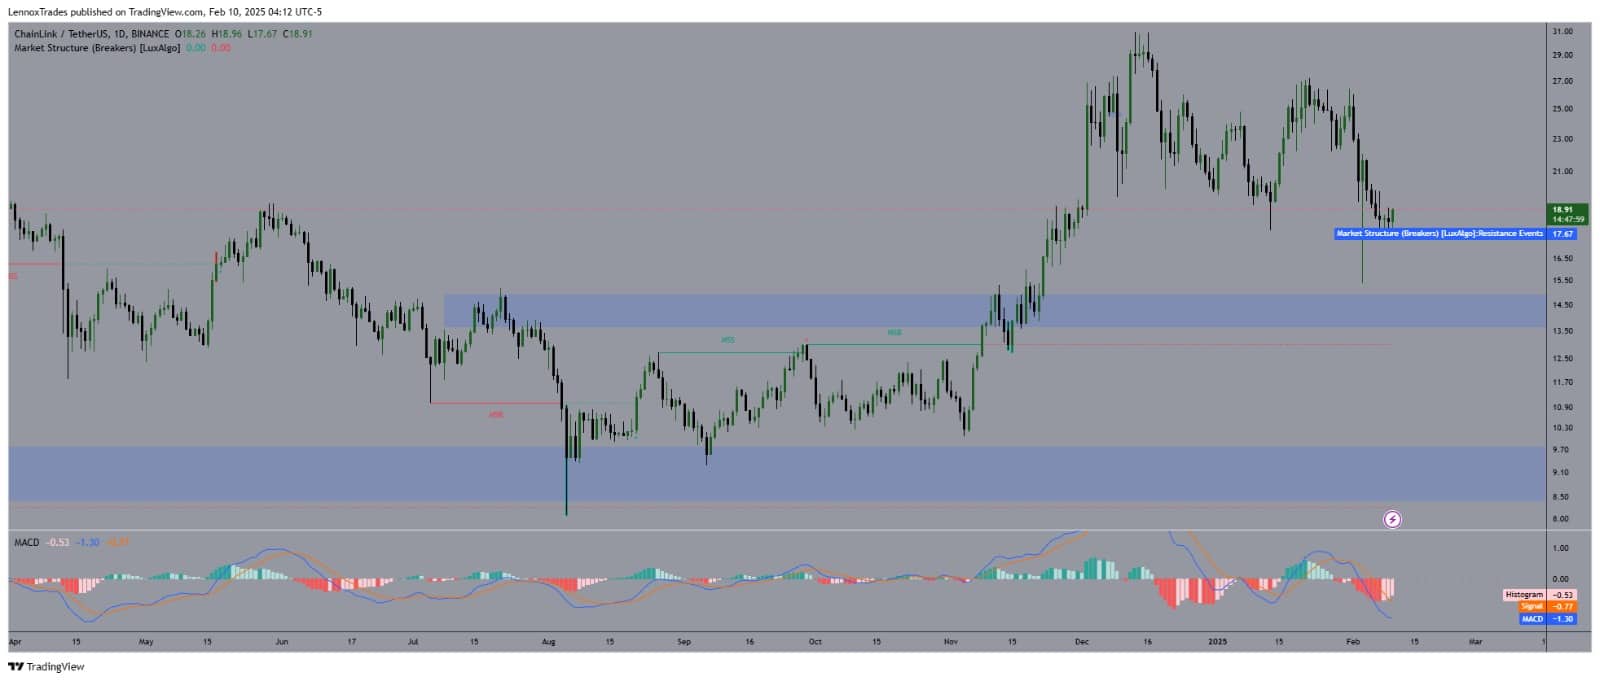
However, a declining MACD histogram or a drop back below the signal line would signal a weakening trend. In that scenario, traders might eye $17 and $15 as possible pullback zones. Such a move would likely coincide with a break below $18, reinforcing the bearish case.
“At the Money” Zone Around $20
Currently, 76.79% of LINK addresses are in profit, suggesting solid backing for higher prices. Meanwhile, 15.73% remain at a loss, so any dip below $18 could prompt these holders to capitulate.

One critical metric is what analysts refer to as the “at the money” percentage, which stands near 8%. “The ‘at the money’ percentage, around 8%, highlighted a transitional zone around $20.” This level may serve as a crucial pivot: if it pierces past $20 with confidence, it could spark a surge toward $25. Conversely, failure to break through this zone could stall momentum and trigger profit-taking.
Renowned market analyst “Charting Guy” projects that LINK is in Elliott Wave 3, potentially pushing its price above $200 from its current $18.39. The analysis points to a prior Wave 2 correction around $13.72, establishing a bullish foundation.
Chainlink Analyst Eyes 3-Digit Surge as Wave 3 Takes Off
Renowned analyst “Charting Guy” projects a strong Wave 3 rally for LINK, potentially driving prices beyond $200. Currently trading near $18.39, it rebounded from a Wave 2 correction around $13.72 and is now on course for a Fibonacci-based target of $230.
Key interim levels include $27.77 and $31.87, while a longer-term peak above $350 may align with Wave 5. Despite growing bullish sentiment and significant community interest, macroeconomic volatility could still disrupt this Elliott Wave forecast.
Conclusion
Chainlink’s immediate future hinges on whether it can defend support at $18 and break above $20 with conviction. Despite signs of a bullish setup from LuxAlgo and MACD, lackluster trading volume highlights the need for stronger buying interest. Meanwhile, most LINK holders remain in profit, raising the stakes around these key levels. If momentum builds, it could climb toward $25. A failure to maintain $18, however, may trigger a deeper correction and leave the token struggling to regain its bullish footing in the near term.
Stay tuned to The BIT Journal and watch Crypto’s updates. Follow us on Twitter and LinkedIn, and join our Telegram channel to be instantly informed about breaking news!
Frequently Asked Questions (FAQs)
1. What key support level is Chainlink testing?
Chainlink is testing the Bull Market Support Band at $18, a level historically linked to bullish momentum.
2. Why is holding above $18 crucial for LINK?
Maintaining support at $18 could pave the way for price targets above $25 in the coming weeks.
3. What risk does a breakdown below $18 pose?
A confirmed break below $18 may trigger heavy selling, pushing LINK toward lower supports around $16.80 or $14.
4. How does the LuxAlgo structure break impact LINK’s momentum?
The LuxAlgo structure break suggests a potential shift in momentum, with buyers quickly defending $18 but caution is needed if selling pressure mounts.
5. What does the MACD indicator signal for Chainlink?
The MACD crossing above the signal line near $18 indicates rising momentum, hinting at tests of resistance near $22 and $25.
6. How does trading volume influence LINK’s price movement?
Low trading volume means that stronger buying pressure is needed to sustain a breakout and reduce volatility.
Glossary of Key Terms:
Chainlink: A decentralized network that connects smart contracts with external real-world data.
Trading volume: The total amount of an asset bought and sold within a specific period.
MACD indicator: A momentum tool that compares moving averages to signal potential trend changes.
Key support level: A critical price point where buying interest typically prevents further decline.
LuxAlgo’s Structure: A technical analysis feature that highlights shifts in market momentum and price trends.
Bull Market Support band: A price range where sustained buying support indicates strong bullish potential.
References:
AMB Crypto: https://ambcrypto.com/
Binance: https://www.binance.com
The Bit Journal – Read More


