


- Bullish NEO price prediction for 2025 is $8.54 to $12.55.
- Neo (NEO) price might reach $50 soon.
- Bearish NEO price prediction for 2025 is $4.55.
In this Neo (NEO) price prediction 2025, 2026-2030, we will analyze the price patterns of NEO by using accurate trader-friendly technical analysis indicators and predict the future movement of the cryptocurrency.
| TABLE OF CONTENTS |
|
INTRODUCTION |
|
|
NEO (NEO) PRICE PREDICTION 2025 |
|
| NEO (NEO) PRICE PREDICTION 2026, 2027-2030 |
| CONCLUSION |
| FAQ |
| Current Price | $6.46 |
| 24 – Hour Trading Volume | $61.83M |
| Market Cap | $456.21M |
| Circulating Supply | 70.53M NEO |
| All – Time Low | $0.07229 (On Oct 21, 2016) |
(Source: CoinMarketCap)
| TICKER | NEO |
| BLOCKCHAIN | Ethereum |
| CATEGORY | Decentralized blockchain |
| LAUNCHED ON | February 2014 |
| UTILITIES | Governance, security, gas fees & rewards |
NEO is a governance token of Neo. Neo is a blockchain ecosystem intended to be used in the development of a smart economy. The Neo Blockchain was first introduced in 2014 under the name Antshares. Three years later, in 2017, the project rebranded as Neo, its current name. There are two native tokens in Neo. NEO, as well as NEO GAS. NEO is used to establish ownership and management roles in the blockchain, while NEO Gas is used to pay for blockchain transactions.
Neo (NEO) ranks 107th on CoinMarketCap in terms of its market capitalization. The overview of the Neo price prediction for 2025 is explained below with a daily time frame.
In the above chart, Neo (NEO) laid out a descending channel pattern. A descending channel, also known as a falling channel, is a bearish technical analysis pattern formed by two parallel downward-sloping trendlines. The upper trendline connects a series of high points, indicating resistance where the price struggles to rise above, while the lower trendline connects the lower points, acting as support.
This pattern suggests that sellers are in control, with the price consistently making lower highs and lower lows. Traders often look to sell near the upper trendline and buy near the lower trendline, as the price typically oscillates within this defined range. Overall, the descending channel helps traders identify potential shorting opportunities and assess market sentiment.
At the time of analysis, the price of Neo (NEO) was recorded at $6.50. If the pattern trend continues, then the price of NEO might reach the resistance levels of $8.84, and $15.73. If the trend reverses, then the price of NEO may fall to the support level of $5.86.
The chart given below elucidates the possible resistance and support levels of Neo (NEO) in 2025.
From the above chart, we can analyze and identify the following as the resistance and support levels of Neo (NEO) for 2024.
| Resistance Level 1 | $8.54 |
| Resistance Level 2 | $12.55 |
| Support Level 1 | $6.34 |
| Support Level 2 | $4.55 |
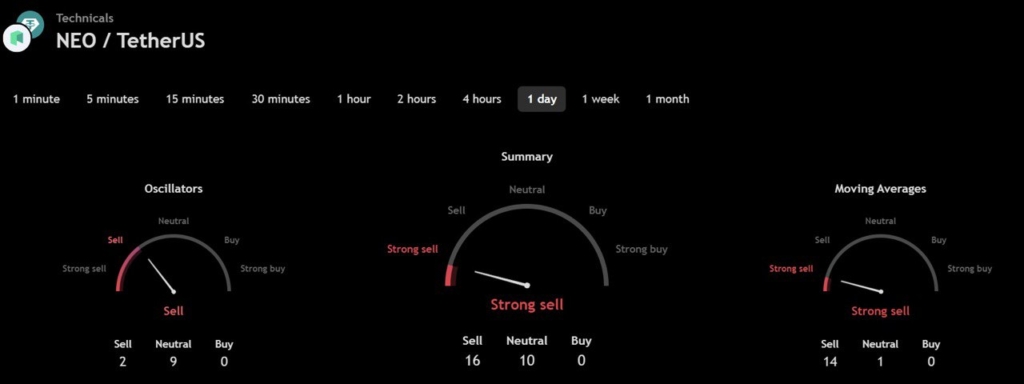
The technical analysis indicators such as Relative Volume (RVOL), Moving Average (MA), and Relative Strength Index (RSI) of Neo (NEO) are shown in the chart below.
From the readings on the chart above, we can make the following inferences regarding the current Neo (NEO) market in 2025.
| INDICATOR | PURPOSE | READING | INFERENCE |
| 50-Day Moving Average (50MA) | Nature of the current trend by comparing the average price over 50 days | 50 MA = $7.78 Price = $6.50 (50MA > Price) |
Bearish/Downtrend |
| Relative Strength Index (RSI) | Magnitude of price change;Analyzing oversold & overbought conditions | 18.77 <30 = Oversold 50-70 = Neutral >70 = Overbought |
Oversold |
| Relative Volume (RVOL) | Asset’s trading volume in relation to its recent average volumes | Below cutoff line | Weak Volume |
In the below chart, we analyze the strength and volatility of Neo (NEO) using the following technical analysis indicators — Average Directional Index (ADX) and Relative Volatility Index (RVI).
From the readings on the chart above, we can make the following inferences regarding the price momentum of Neo (NEO).
| INDICATOR | PURPOSE | READING | INFERENCE |
| Average Directional Index (ADX) | Strength of the trend momentum | 37.73 | Very Strong Trend |
| Relative Volatility Index (RVI) | Volatility over a specific period | 26.67 <50 = Low >50 = High |
Low Volatility |
Let us now compare the price movements of Neo (NEO) with that of Bitcoin (BTC), and Ethereum (ETH).
From the above chart, we can interpret that the price action of NEO is similar to that of BTC and ETH. That is, when the price of BTC and ETH increases or decreases, the price of NEO also increases or decreases respectively.
With the help of the aforementioned technical analysis indicators and trend patterns, let us predict the price of Neo (NEO) between 2026, 2027, 2028, 2029, and 2030.
| Year | Bullish Price | Bearish Price |
| Neo (NEO) Price Prediction 2026 | $89 | $4 |
| Neo (NEO) Price Prediction 2027 | $90 | $3 |
| Neo (NEO) Price Prediction 2028 | $100 | $2 |
| Neo (NEO) Price Prediction 2029 | $125 | $1 |
| Neo (NEO) Price Prediction 2030 | $150 | $0.9 |
If Neo (NEO) establishes itself as a good investment in 2025, this year would be favorable to the cryptocurrency. In conclusion, the bullish Neo (NEO) price prediction for 2025 is $12.55. Comparatively, the bearish Neo (NEO) price prediction for 2025 is $4.55.
If there is a positive elevation in the market momentum and investors’ sentiment, then Neo (NEO) might hit $50. Furthermore, with future upgrades and advancements in the Neo ecosystem, NEO might surpass its current all-time high (ATH) of $196.85 and mark its new ATH.
NEO is a governance token of Neo. Neo is a blockchain ecosystem designed to aid in the creation of a smart economy.
Traders can trade Neo (NEO) on cryptocurrency exchanges such as Binance, FMFW.io, OKX, Upbit, DigiFinex.
With the ongoing developments and upgrades within the Neo platform, Neo (NEO) has a high possibility of reaching its ATH soon.
Neo (NEO) hit its current all-time high (ATH) of $196.85 on Jan 15, 2018.
According to CoinMarketCap, NEO hit its all-time low (ATL) of $0.07229 on Oct 21, 2016.
If Neo (NEO) becomes one of the active cryptocurrencies that majorly maintain a bullish trend, it might rally to hit $50 soon.
Neo (NEO) price might reach $89 by 2026.
Neo (NEO) price might reach $90 by 2027.
Neo (NEO) price might reach $100 by 2028.
Neo (NEO) price might reach $125 by 2029.
Top Crypto Predictions
Toncoin (TON) Price Prediction
Shiba Inu (SHIB) Price Prediction
Disclaimer: The opinion expressed in this article is solely the author’s. It does not represent any investment advice. TheNewsCrypto team encourages all to do their own research before investing.
share
TheNewsCrypto – Read More