


While some analysts foresee a major rebound, with one chart pattern indicating a possible 190% surge, market conditions present key challenges that could stand in the way of a recovery.
The Livermore Speculative Chart Signals a Potential Rebound
A key argument for a bullish turnaround comes from the Livermore Speculative Chart (LSC), a classic technical pattern attributed to legendary trader Jesse Livermore. According to crypto analyst Daze, PEPE has reached the seventh phase of the pattern, which historically precedes a major price breakout.
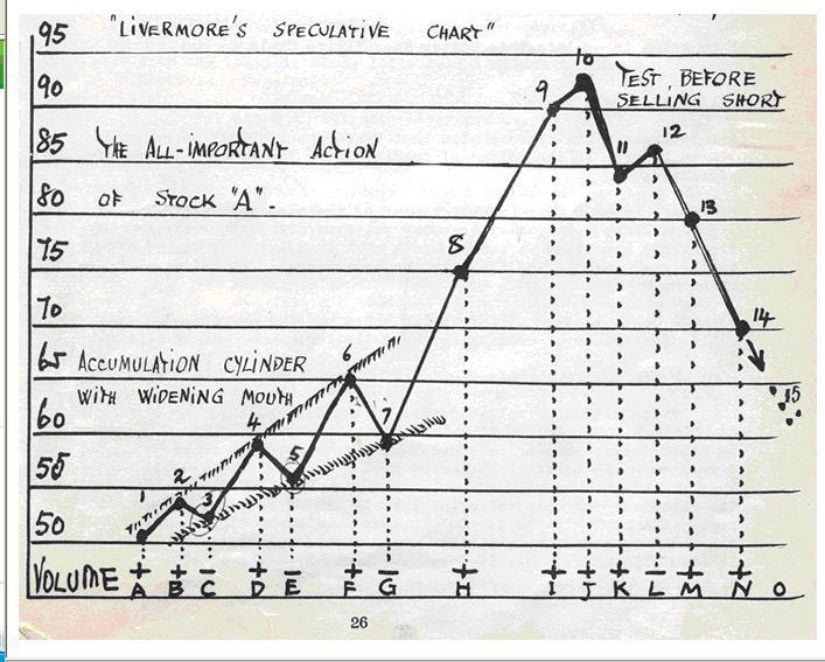
Livermore’s speculative chart. Source: Daze via X
“If history repeats itself, Pepe Coin could see a significant recovery from its current lows,” Daze noted. However, he also warned that such a reversal could take time, as weekly chart formations typically play out over several weeks or months.
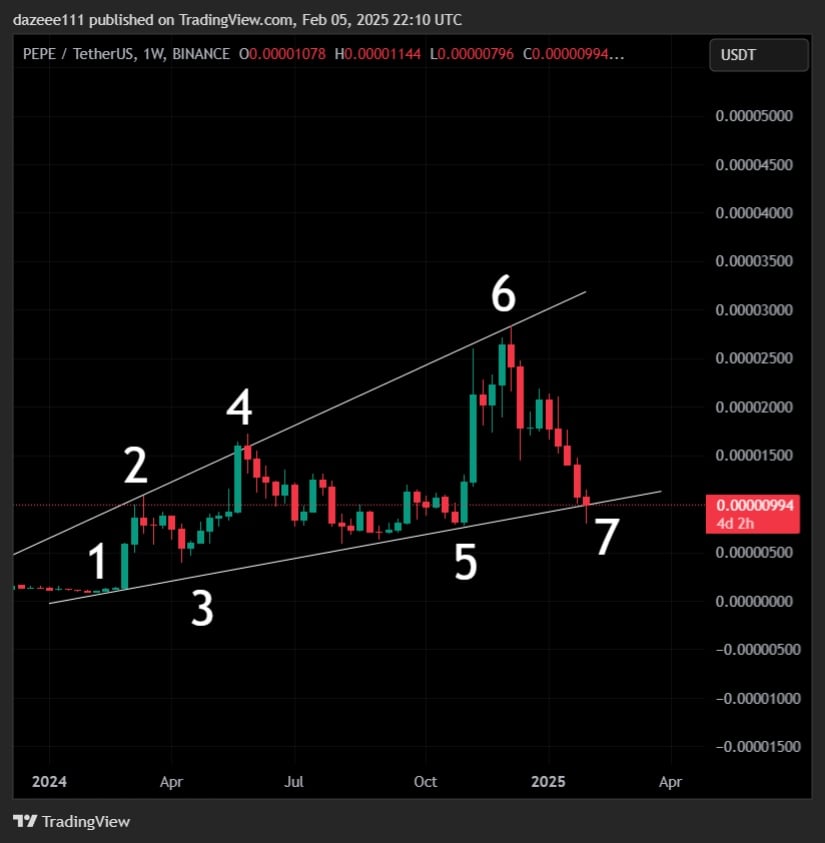
The speculative pattern was detected on Pepe Coin’s weekly price chart. Source: Daze via X
If PEPE follows this pattern, a rally to its previous all-time high of $0.00002830 would represent a 190% surge from its current levels. Still, this outlook comes with notable risks.
Bearish Signals Persist: Head-and-Shoulders and Death Cross Patterns
While the Livermore formation presents a compelling bullish case, PEPE’s daily chart paints a more cautious picture. The head-and-shoulders pattern formed by the meme coin is an infamous bearish reversal indicator that usually points to further downsides.
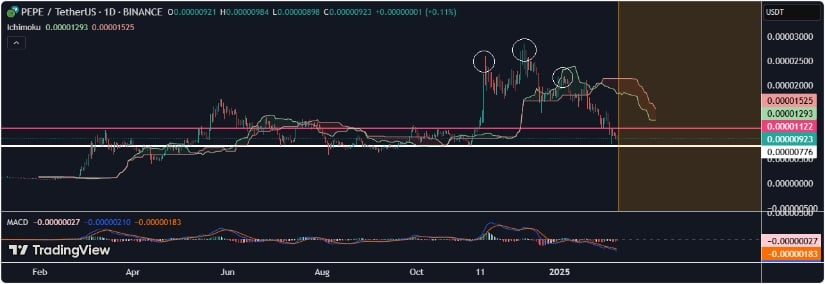
The Pepe coin price has broken the critical support at $0.000010 following the head and shoulder pattern move. Source: JumpStartCrypto on TradingView
Another critical concern is the formation of a “death cross” where the 50-day moving average falls below the 200-day moving average. This pattern often tends to indicate stubbornly bearish momentum, therefore leading one to believe that the price for PEPE may have difficulty bouncing back in the short term.
In addition, the coin is below the 61.8% Fibonacci level, which is usually an important support level for recoiling the price. If PEPE does not manage to stay at this level, it will sink further to 78.6% retracement at $0.00000673.
Watch – Pepe Coin Price Analysis
Whale Accumulation Sparks Optimism
Despite the bearish technical signals, some large investors appear to be taking advantage of the price dip. On-chain data reveals that a prominent whale recently purchased 280 billion PEPE tokens, increasing their holdings to $13.2 million.
This accumulation could be a sign that institutional players see long-term potential in PEPE, despite its short-term struggles. If similar buying activity continues, it could provide the necessary fuel for a price reversal.
Key Support and Resistance Levels to Watch
As PEPE navigates its current price territory, several critical levels will determine its next move. On the downside, the November support level at around $0.0000080 remains a crucial test. This area previously triggered a strong rally and has acted as a historical price floor.
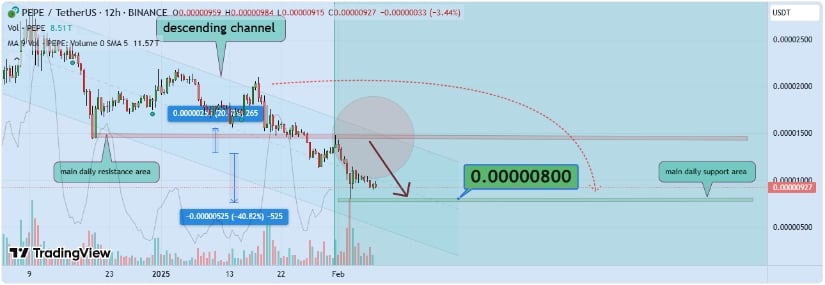
The PEPE price must survive the $0.000008 support to revive the bullish hope. Source: MadWhale on TradingView
If this support holds, PEPE could see a bounce toward the 100-day exponential moving average (EMA) at $0.000012. A more extended rally could target $0.00001784, which corresponds to the 38.2% Fibonacci retracement level.
Conversely, a breakdown below the $0.0000080 support could open the doors to deeper losses, with the next key level around $0.000006. Such a move would invalidate the bullish Livermore pattern and reinforce the bearish outlook.
Market Sentiment and Bitcoin Dominance
Another factor influencing PEPE’s price trajectory is the broader crypto market trend. Bitcoin dominance has surged above 60%, putting pressure on altcoins and meme coins like PEPE. Historically, meme coins tend to struggle when Bitcoin outperforms, as investors flock to safer assets.
Sentiment indicators also reflect this uncertainty. Social volume, a measure of online discussions surrounding PEPE, has been declining since December, signaling waning retail interest. However, a slight recovery in weighted sentiment suggests that some traders are beginning to take a more neutral stance.
Final Thoughts: A High-Risk, High-Reward Bet
Pepe Coin’s price action remains highly volatile, with contrasting signals from different technical indicators. While the Livermore Speculative Chart suggests a potential 190% rally, bearish patterns like the death cross and head-and-shoulders formation caution against excessive optimism.
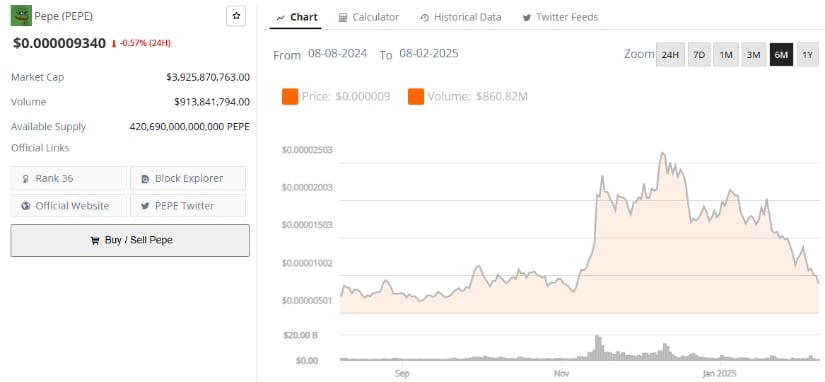
Pepe Coin (PEPE) was trading at around $0.000009340, down 0.57% in the last 24 hours at press time. Source: Brave New Coin
For traders, the key question is whether PEPE can hold its crucial support levels and attract further whale accumulation. A decisive break above $0.000012 could signal renewed bullish momentum, while a drop below $0.0000080 could pave the way for further declines.
As always, investors should approach PEPE with caution, recognizing the high-risk nature of meme coins and the broader market conditions that could influence its price movements.
Brave New Coin – Read More