


However, a glimmer of hope appeared as the digital asset recorded its first strong inflows in February, signaling a change in sentiment. Read on for our latest Solana price predictions.
Solana has been struggling, slipping nearly 28% from its January 19 peak of $294.33. However, a glimmer of hope appeared as the digital asset recorded its first spot inflow in February, signaling a possible change in sentiment. Investor confidence may be returning, and the numbers tell an impressive story.
On Monday, Solana saw a $16 million spot market inflow, the first significant buying activity in ten days, according to CoinGlass. The sudden influx suggests renewed interest as traders attempt to keep SOL above the critical $200 mark. Spot inflows often indicate a shift in market sentiment, hinting that investors are willing to buy at current prices.
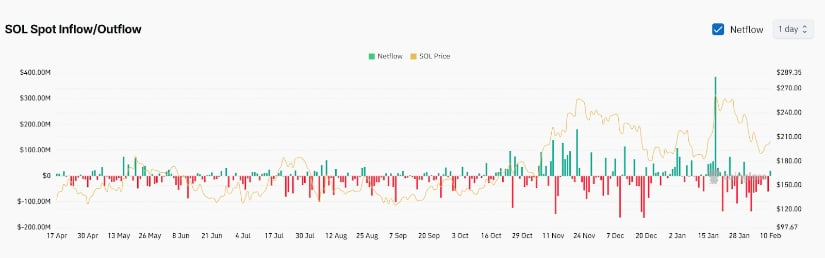
SOL Spot Inflow/Outflow chart | Source: CoinGlass
Adding to the positive signals, Solana’s Balance of Power (BoP) shows a reading of 0.65, signaling bullish momentum. Buyers are gaining ground, suggesting stronger demand. If momentum holds, an upward trend could continue.
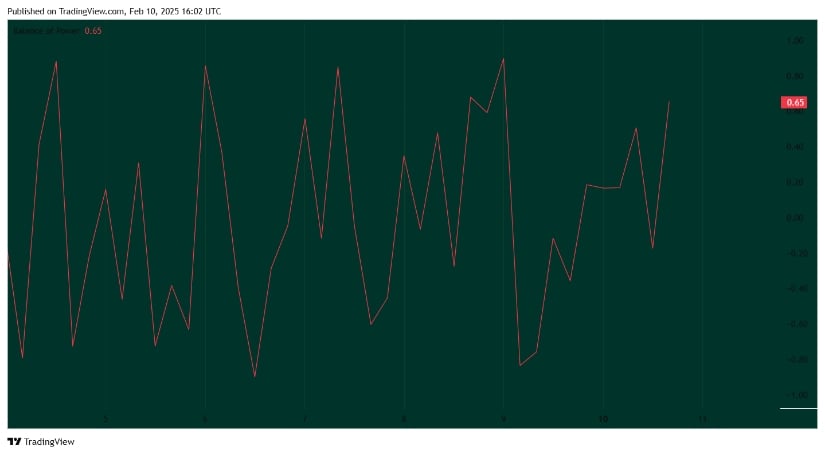
Balance of Power chart | Source: TradingView
Regulatory Landscape and Market Sentiment
Solana is inching closer to a Spot ETF approval. On February 6, the SEC officially acknowledged Grayscale’s proposal to convert its Solana Trust into an ETF and opened the doors to an October decision. On the same day, four fund managers filed applications to introduce an XRP ETF amid new interest in regulation-friendly investment products for crypto assets. Bitwise has also applied for a Solana Spot ETF.
Key Price Levels and Resistance Ahead
Technical indicators paint a mixed picture. The Relative Strength Index (RSI) sits at 53.47, leaning slightly bullish, with a moving average of 50.97. If RSI moves above 55, it could signal stronger momentum, giving SOL a chance to test the $210–$215 range. Meanwhile, the 50-day Exponential Moving Average (EMA) is at $212.58, and the 200-day EMA stands at $216.11, both acting as resistance.
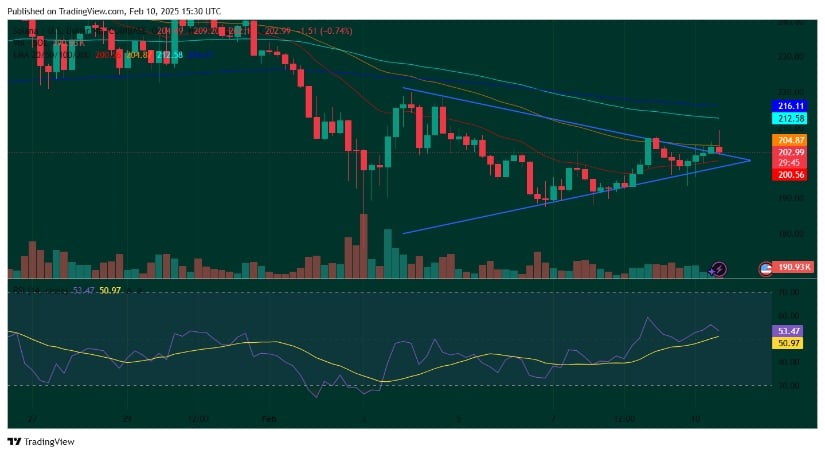
Solana breakout from an ascending triangle pattern | Source: TradingView
Solana’s price action has been forming a symmetrical triangle, with support holding firm around $200.56. If this support breaks, a drop toward $190 becomes possible. On the flip side, if SOL manages to break above $205 with strong volume, it could spark a rally. Analysts suggest keeping an eye on trading volume for confirmation of any breakout move.
Can SOL Reclaim $250 or Sink to $190?
Despite the recent drop, some traders remain optimistic. The asset’s volume currently stands at 190.93K, indicating moderate market activity. A surge in volume could be the missing ingredient for a decisive move in either direction. If SOL can reclaim the 50-day EMA at $212.58, the next target would likely be $220.
However, failure to hold the $200 support could bring renewed downside pressure. A breakdown from current levels could show that the price test is in lower ranges, with bears eyeing the $190 level as the next potential stop. The coming days will be crucial in determining whether Solana can sustain a recovery or if selling pressure will continue to weigh on the asset.
A confirmed breakout above $250 could open doors for a rally toward the $300 mark. If Solana manages to sustain upward momentum, it may signal a continuation of its long-term bullish trend. On the other hand, if resistance holds firm and buyers fail to push past key levels, a deeper retracement could be in store.
Brave New Coin – Read More