


Solana (SOL) has declined since its rejection of the $260 top price.
Long-term Solana price forecast: bearish
The cryptocurrency dropped and reached the 1.618 Fibonacci extension level or $192.76, which was the price prediction. The downtrend resumed its volatility above the current support at $190 after hitting the expected price level twice.
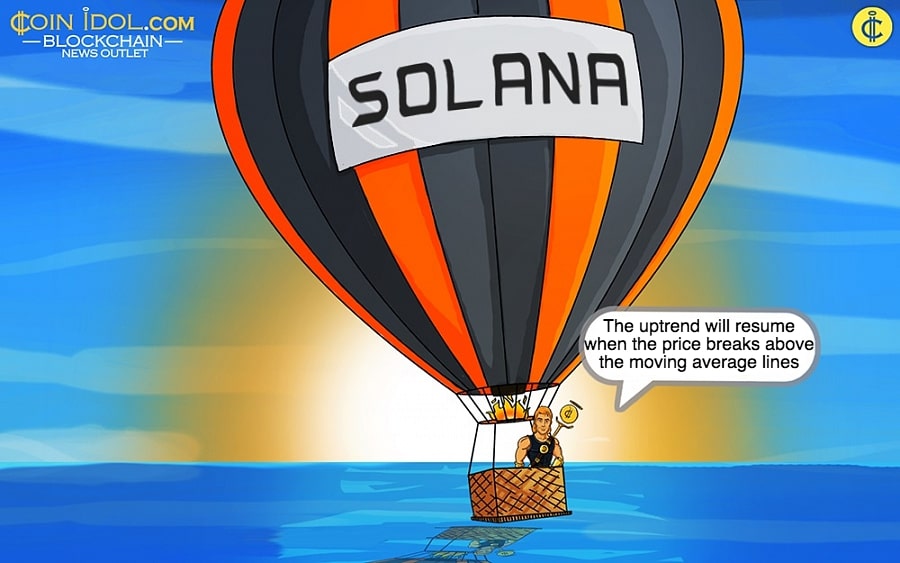
Solana has been trading below the moving average lines and above the $190 support since February 6. The moving average lines have hindered the upward moves. The uptrend will resume when the price breaks above the moving average lines.
Similarly, Solana will return to the previous low at $176 if the bears break below $190 support. Meanwhile, Solana price is $201.
SOL price indicator analysis
The price of the cryptocurrency has fallen below the moving average lines. The selling pressure has eased above the support level of $190. The price bars on the 4-hour chart show the sideways movement since February 3 and are above and below the moving average lines.
Technical indicators
Key supply zones: $220, $240, $260
Key demand zones: $140, $120, $100
 - FEB 11, 2024")
What’s next for Solana?
On the 4-hour chart, the price of Solana has resumed its sideways movement after the price drop on February 3. The altcoin is trading in a relatively narrow range between $190 and $210.
The presence of doji candlesticks causes the price of cryptocurrencies to move slowly. The doji candlesticks limit the price movement as the resistance of $210 stands in the way of bigger rises. The sideways movement will continue if the levels within the trading range are not broken.
 FEB.11, 2025")
Disclaimer. This analysis and forecast are the personal opinions of the author. They are not a recommendation to buy or sell cryptocurrency and should not be viewed as an endorsement by CoinIdol.com. Readers should do their research before investing in funds.
CoinIdol.com News – Read More