Cryptocurrency analysts of Coinidol.com report, Solana (SOL) has been trading above the 21-day SMA support since January 27.
Solana long term price forecast: fluctuating
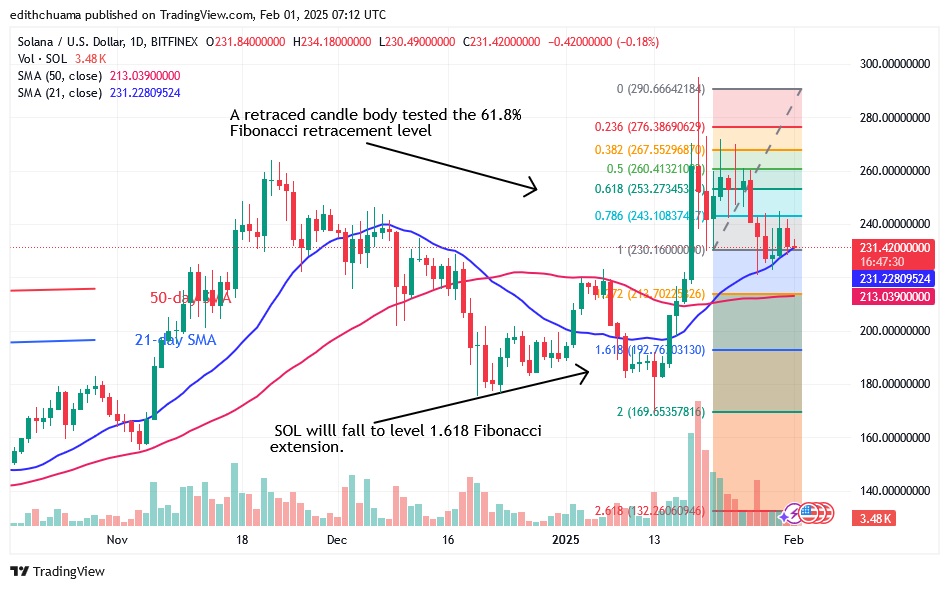
The bulls have defended the 21-day SMA support and saved the altcoin from a decline. The cryptocurrency will rally if the 21-day SMA support holds. Solana may rise and regain the overhead resistance if the level of $260 is reached.
However, the bears broke below the 21-day SMA support and the downside momentum extends to the low of the 50-day SMA. The break below the moving average lines pushed the altcoin to the 1.618 Fibonacci extension or $192.76. Today SOL is worth $205.
Analysis of the Solana price indicator
Analysis of the Solana price indicator
The price bars extend slightly above the moving average lines. SOL will continue the selling pressure as the 21-day SMA is breached.

Technical indicators
Key supply zones: $220, $240, $260
Key demand zones: $140, $120, $100
What is the next development for Solana?
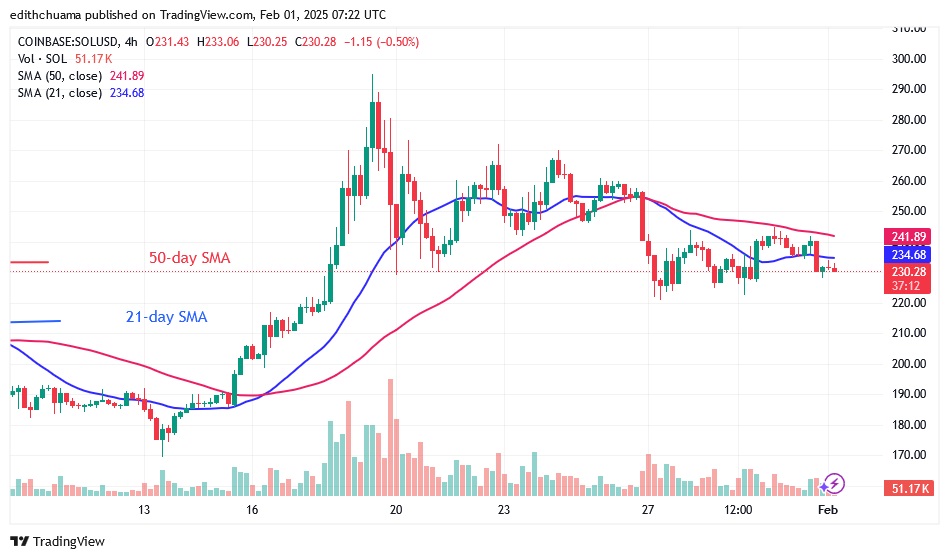
On the 4-hour chart, Solana is below the moving average lines on the decline. The altcoin has moved below the moving average lines but above the $230 support level.
The price indicator predicts that Solana will fall above the $192 support. Currently, the price action is being delayed by the presence of doji candlesticks.

Disclaimer. This analysis and forecast are the personal opinions of the author. They are not a recommendation to buy or sell cryptocurrency and should not be viewed as an endorsement by CoinIdol.com. Readers should do their research before investing in funds.
CoinIdol.com News – Read More


