


Dogecoin (DOGE) has reached a pivotal juncture on its four-hour chart, according to a new technical analysis shared by crypto analyst Satori (@Satori_BTC). The chart, posted on X, highlights Dogecoin’s current interaction with the middle band of the Bollinger Bands—often used to measure volatility and potential support/resistance levels—around $0.19.
Dogecoin At A Crucial Level
Satori notes that $0.19 represents the middle band, which aligns closely with a horizontally drawn support zone on the chart. In the past, this region has visibly acted as a price floor, evident from multiple candle bodies and wicks converging near this level.
The Bollinger Bands themselves, displayed as red (upper band) and green (lower band) envelopes, are narrowing compared to earlier periods, suggesting that market volatility could soon pick up if price action closes firmly above or below these bands.
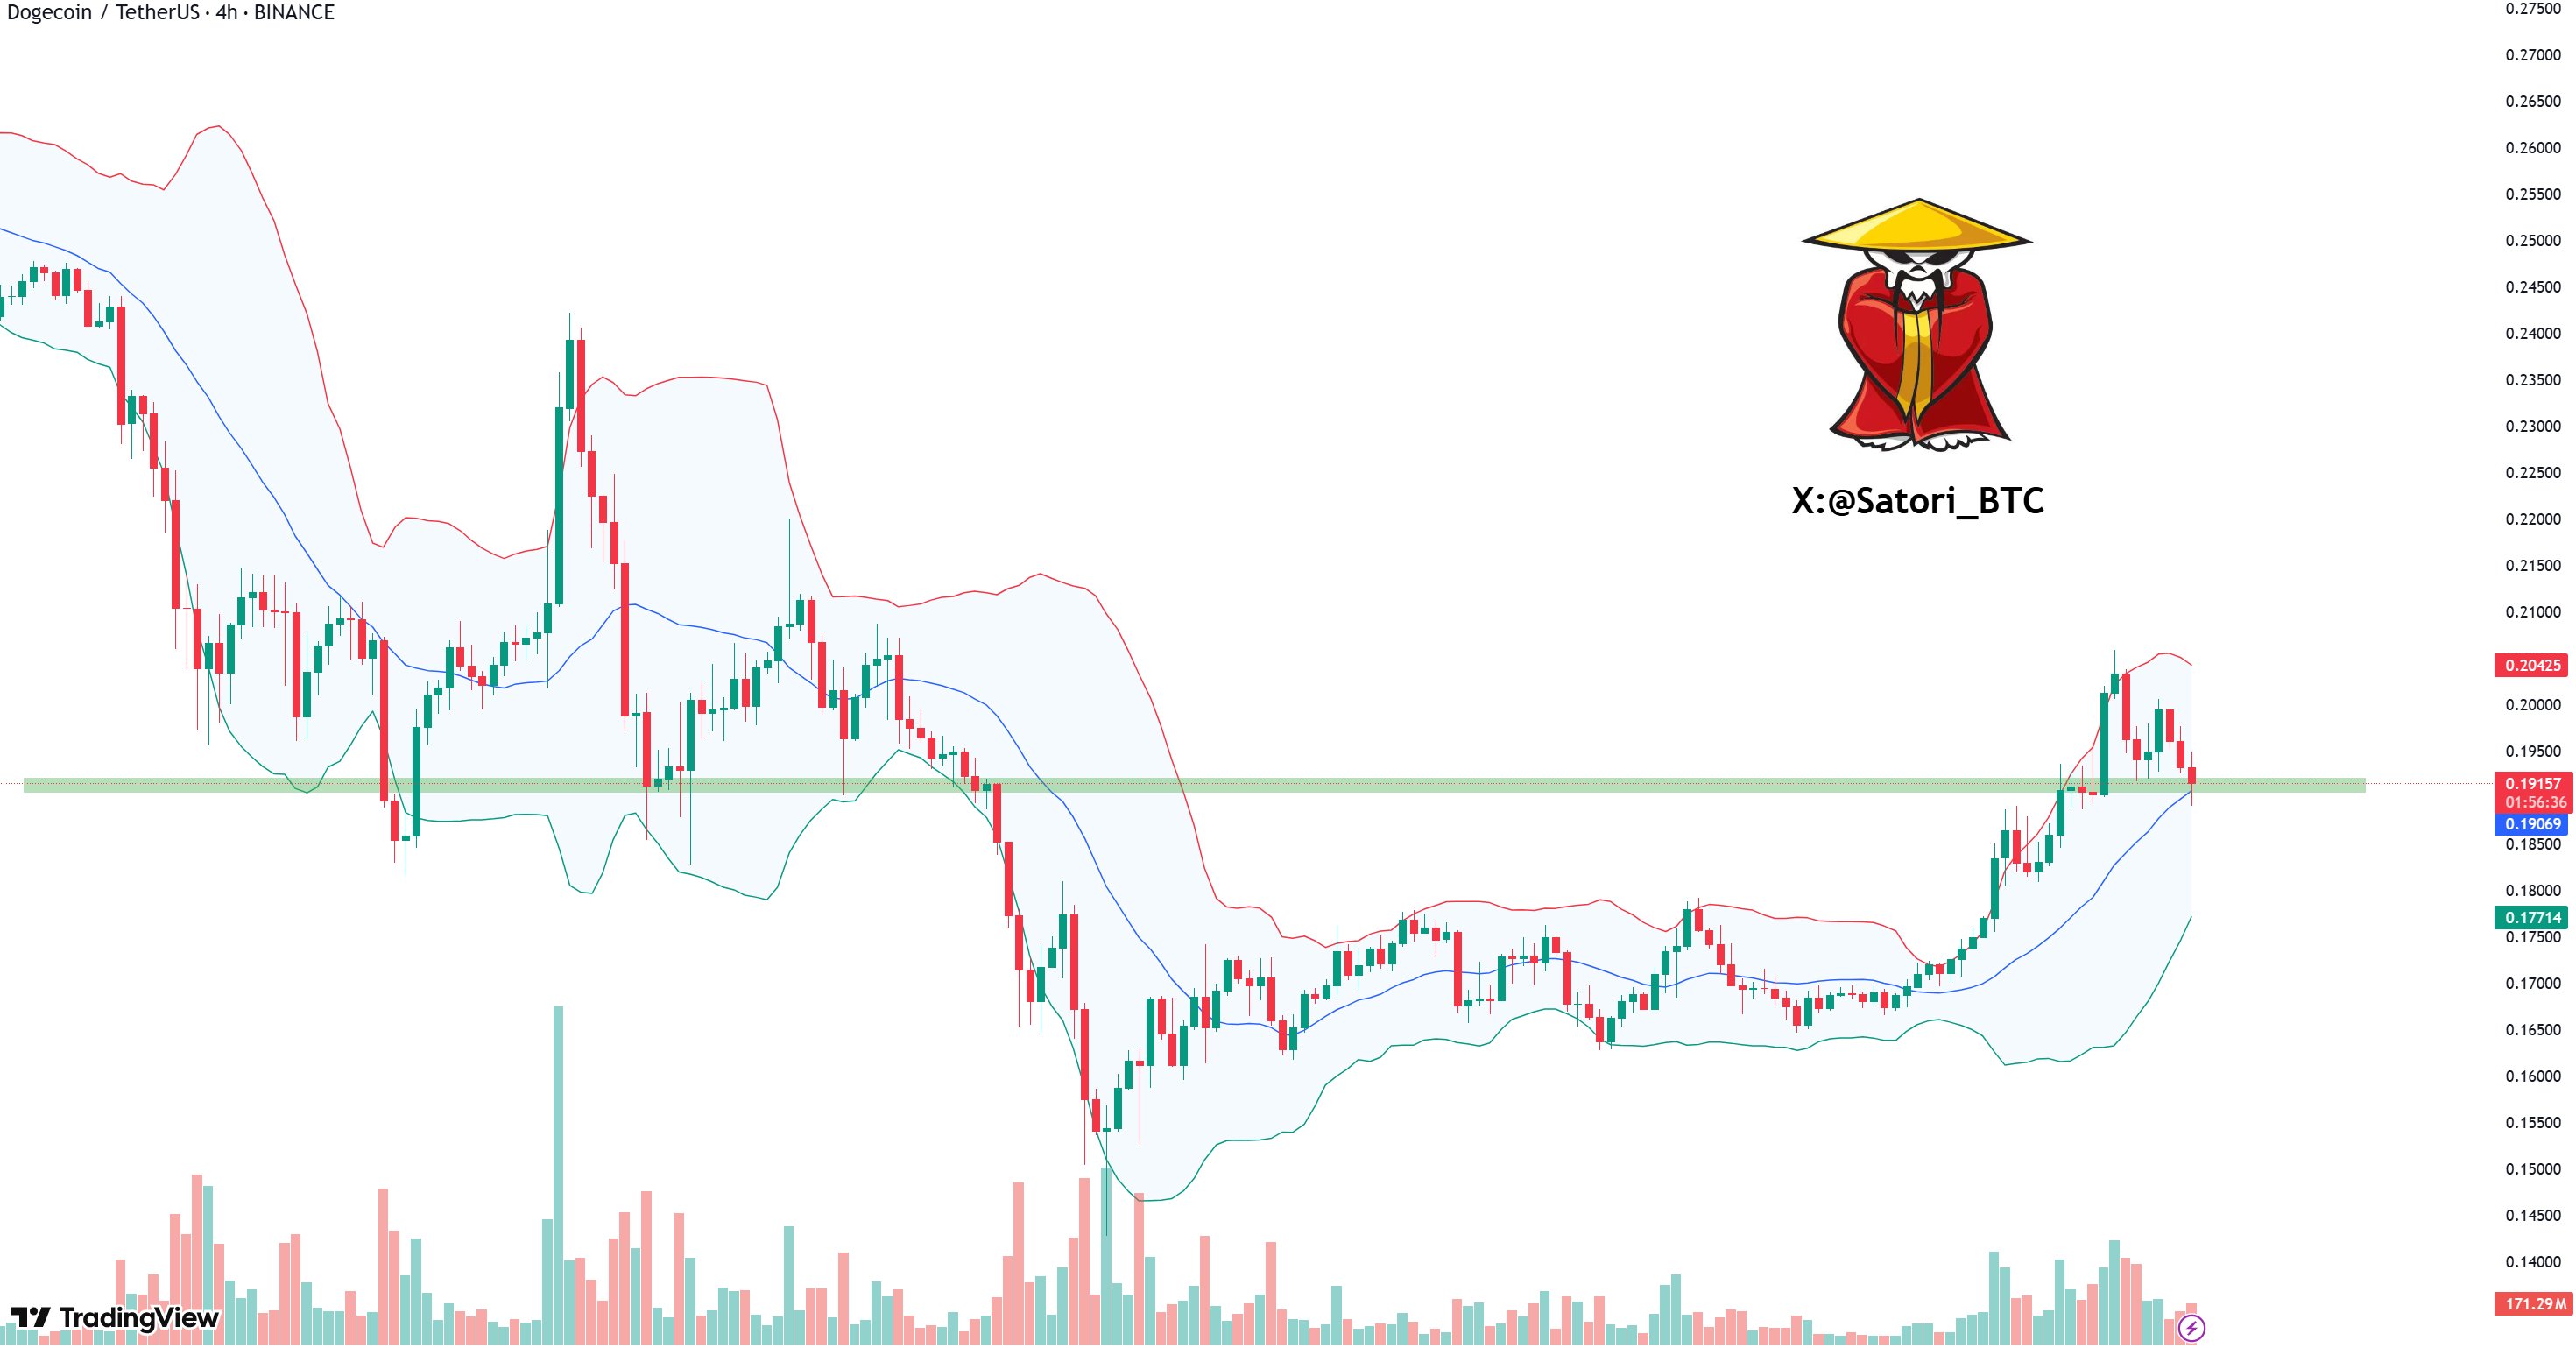
Volume bars beneath the price candles underscore periods of heightened trading activity, with one notable spike visible during the last significant upward move—indicating strong participation from market participants when DOGE rallied from the $0.17 area to above $0.19. Currently, volume appears moderate, but Bollinger Band constrictions often foreshadow more pronounced volatility.
The upper Bollinger Band, shown in red, hovers near $0.204, an area where recent price candles peaked before retreating to the middle band. If DOGE decisively reclaims this higher boundary, bullish traders may look for extended upside momentum. Conversely, the lower Bollinger Band is now situated in the mid-$0.17 range, a level Satori highlights as the next notable support should $0.19 fail to hold.
Satori’s commentary warns of potential volatility if the middle band breaks down. “DOGE has reached the middle band of the Bollinger Bands, indicating support around $0.19. If this level is breached, monitor the support near $0.17. Be cautious of potential volatility as the market reacts to these levels.”
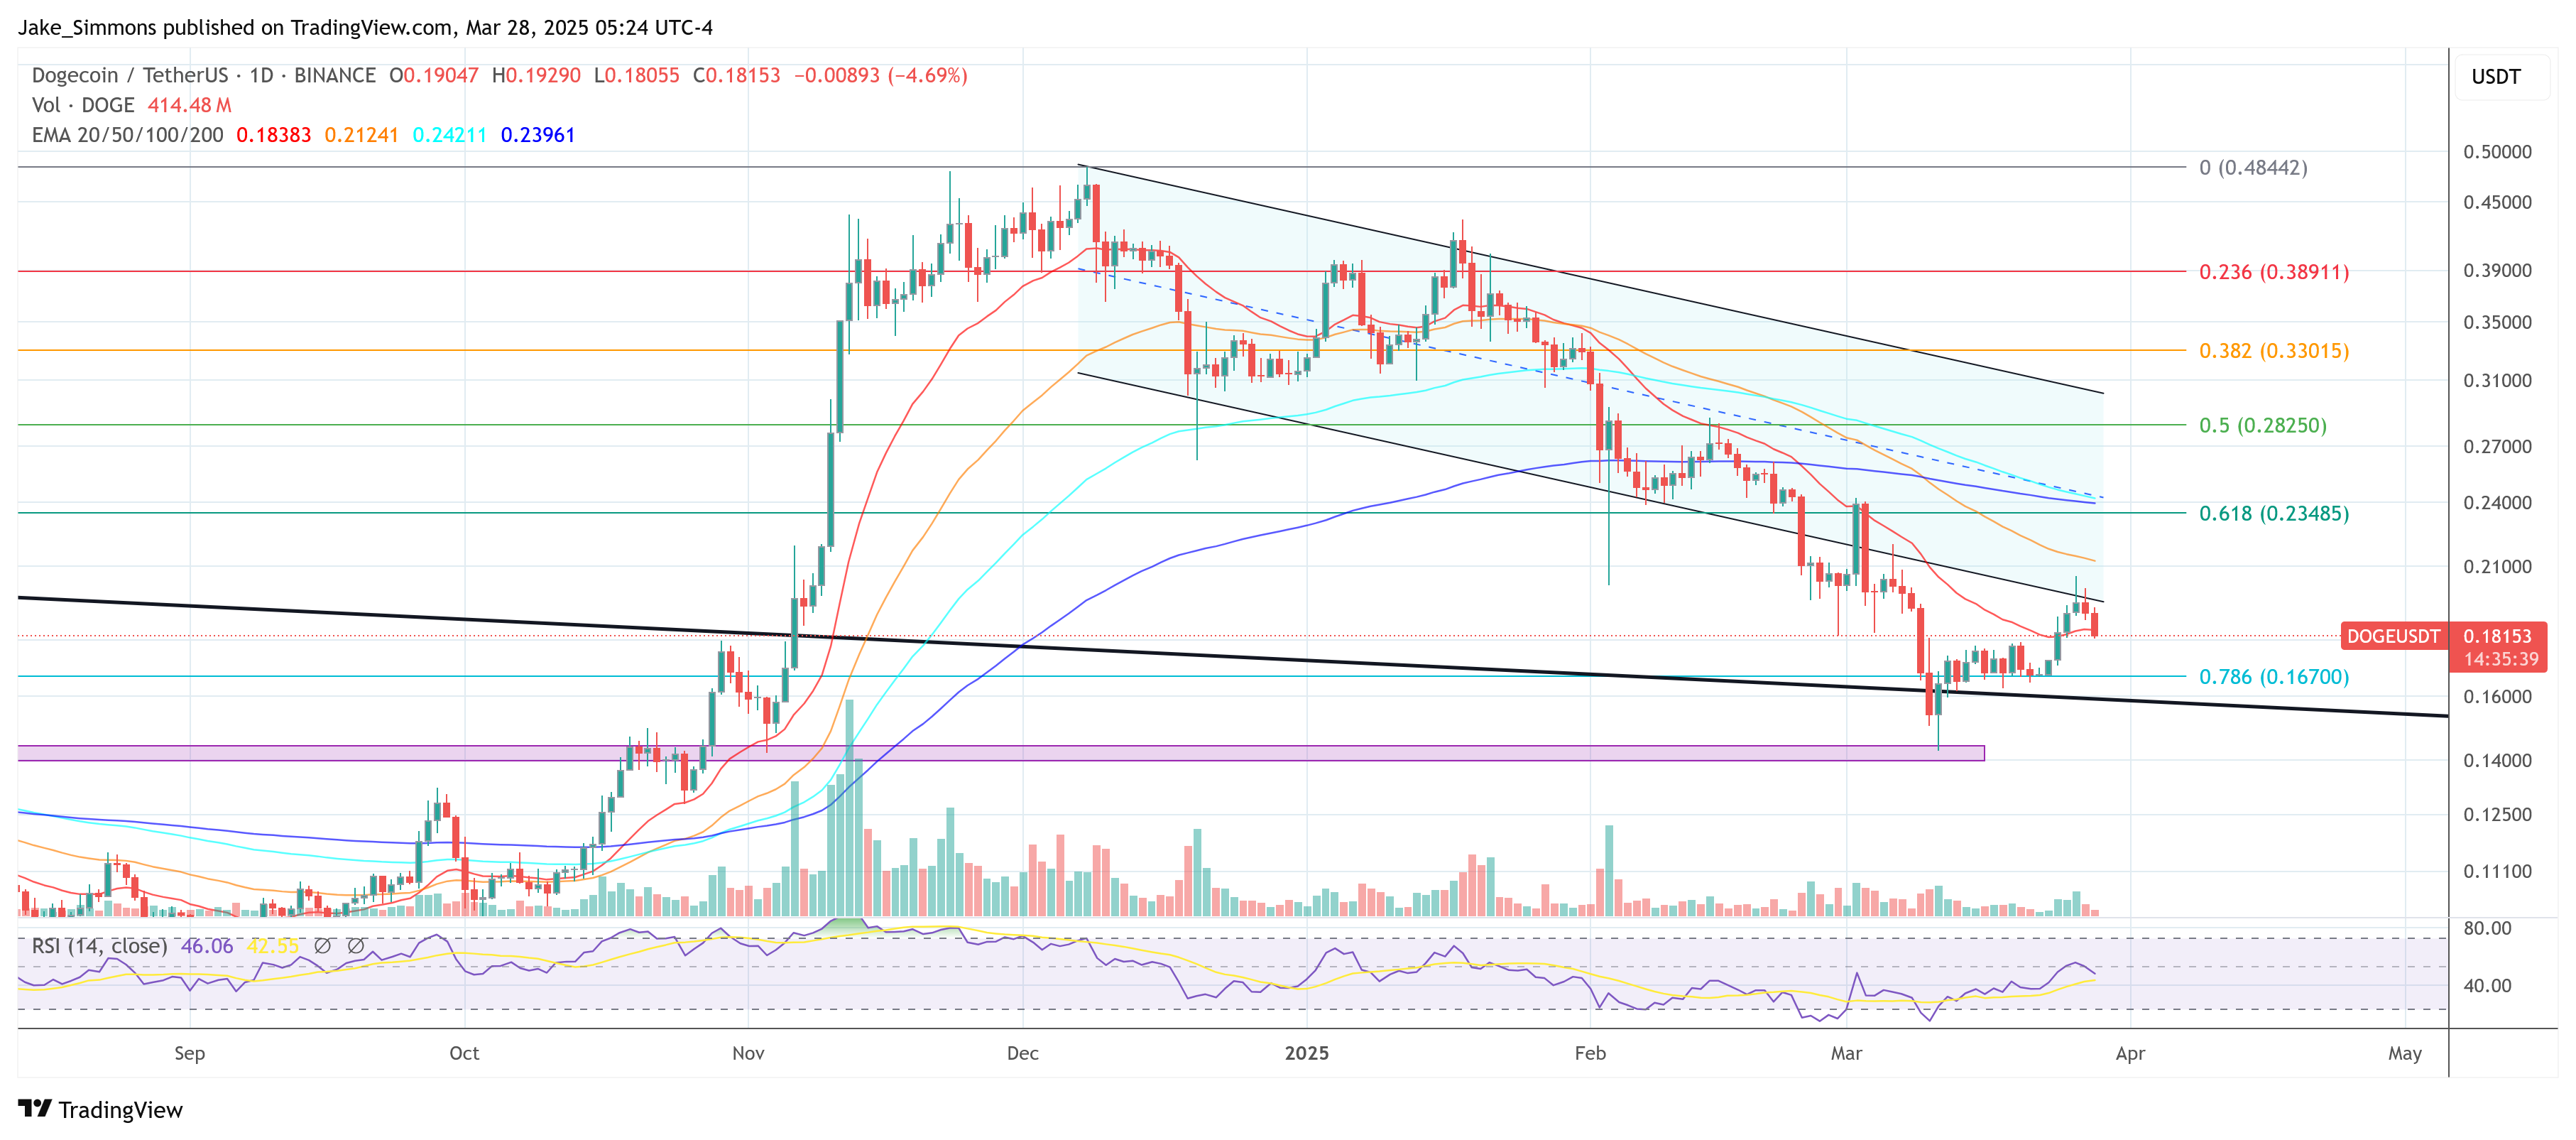
As of this writing, DOGE is trading just above $0.181, hovering below the Bollinger Bands’ middle line. Notably, the price failed to re-enter the descending channel on the daily chart—a formation that guided Dogecoin’s movement from early December until late February. After breaking below that channel, DOGE tested a multi-year trendline on the weekly chart but successfully held it.
Since then, it has climbed back above the 0.786 Fibonacci level. However, the latest rejection at the channel’s lower boundary puts the $0.167 support—which aligns closely with the lower Bollinger Band highlighted by Satori—squarely back in focus. Holding this level is crucial to maintain the bullish momentum.
NewsBTC – Read More
 English
 Afrikaans
 Albanian
 Amharic
 Arabic
 Armenian
 Azerbaijani
 Basque
 Belarusian
 Bengali
 Bosnian
 Bulgarian
 Catalan
 Cebuano
 Chichewa
 Chinese (Simplified)
 Chinese (Traditional)
 Corsican
 Croatian
 Czech
Czech Danish
 Dutch
Dutch Esperanto
 Estonian
 Filipino
 Finnish
 French
 Frisian
 Galician
 Georgian
 German
 Greek
Greek Gujarati
 Haitian Creole
 Hausa
Hausa Hawaiian
 Hebrew
 Hindi
Hindi Hmong
Hmong Hungarian
 Icelandic
 Igbo
Igbo Indonesian
 Irish
Irish Italian
 Japanese
 Javanese
 Kannada
 Kazakh
 Khmer
Khmer Korean
 Kurdish (Kurmanji)
 Kyrgyz
 Lao
Lao Latin
Latin Latvian
 Lithuanian
 Luxembourgish
 Macedonian
 Malagasy
 Malay
Malay Malayalam
 Maltese
 Maori
Maori Marathi
 Mongolian
 Myanmar (Burmese)
 Nepali
 Norwegian
 Pashto
 Persian
 Polish
 Portuguese
 Punjabi
 Romanian
 Russian
 Samoan
 Scottish Gaelic
 Serbian
 Sesotho
 Shona
Shona Sindhi
 Sinhala
 Slovak
 Slovenian
 Somali
 Spanish
 Sundanese
 Swahili
 Swedish
 Tajik
Tajik Tamil
Tamil Telugu
 Thai
Thai Turkish
 Ukrainian
 Urdu
Urdu Uzbek
Uzbek Vietnamese
 Welsh
Welsh Xhosa
Xhosa Yiddish
 Yoruba
 Zulu
Zulu